// Paste into your site-wide header field. // Only injects schema on /agent/joujou-chawla — no other page is affected.
August 2024 Market Report

August 2024 Market Report

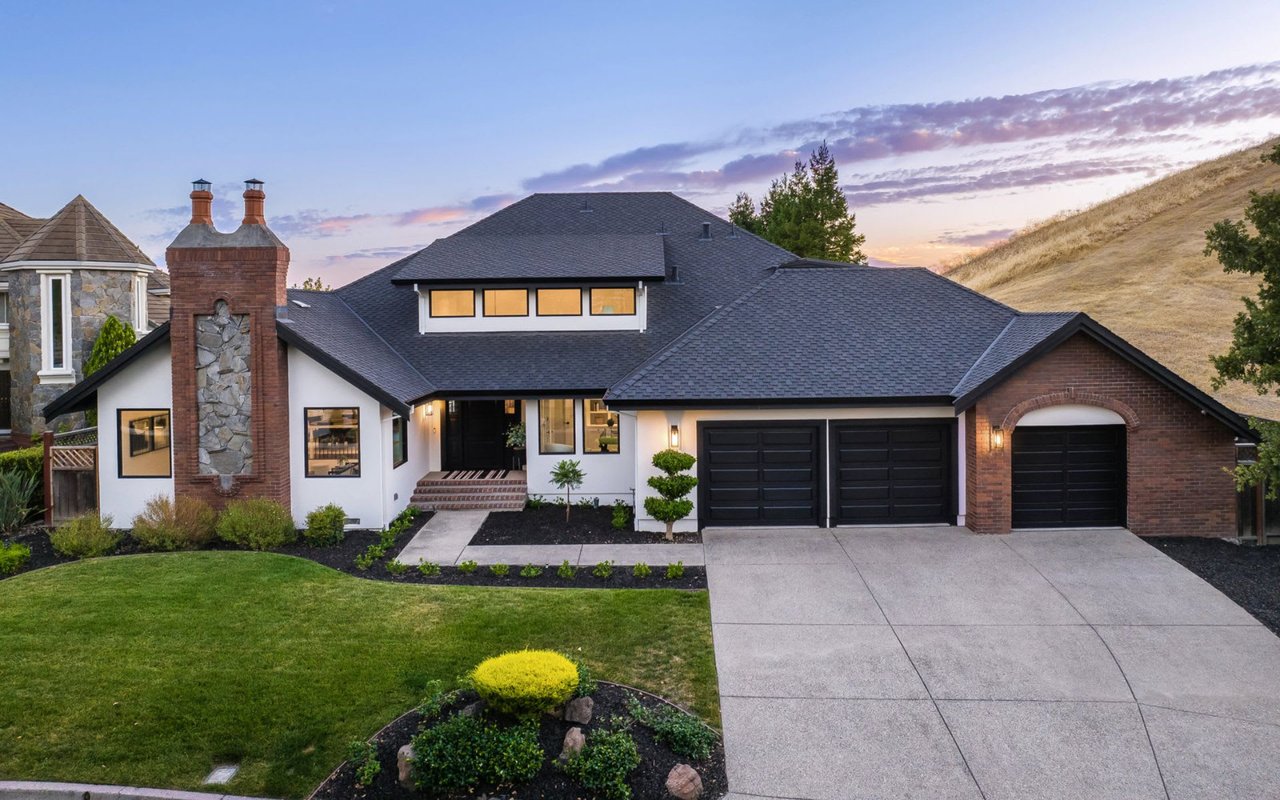
Coming Soon! 653 Blue Spruce Dr., Blackhawk

5 BD | 3.5 BA | 3,475 SF | 0.21 AC

Offered at $3,888,800
 
Completed in April 2024, this “new home” is designed to cater to today’s active lifestyle.

 
Joujou Chawla and Compass
 
There’s been a lot of buzz lately about changes in the real estate market, especially with commission adjustments and fluctuating interest rates. Naturally, this has people questioning whether now is the right time to buy or sell. My best advice? It’s essential to weigh the pros and cons based on your specific circumstances. Every situation is unique, and I’m here to help you navigate these decisions. Let’s sit down and discuss what’s best for you. Together, we’ll determine the perfect time to make your move.
 
Wishing you a great day ahead, may you achieve whatever you have planned for today and the rest of the year.

 
(510) 406-4836
 
[email protected]
 
Joujou Chawla in a red floral jacket beside her handwritten-style sign-off.
 
Market update
 
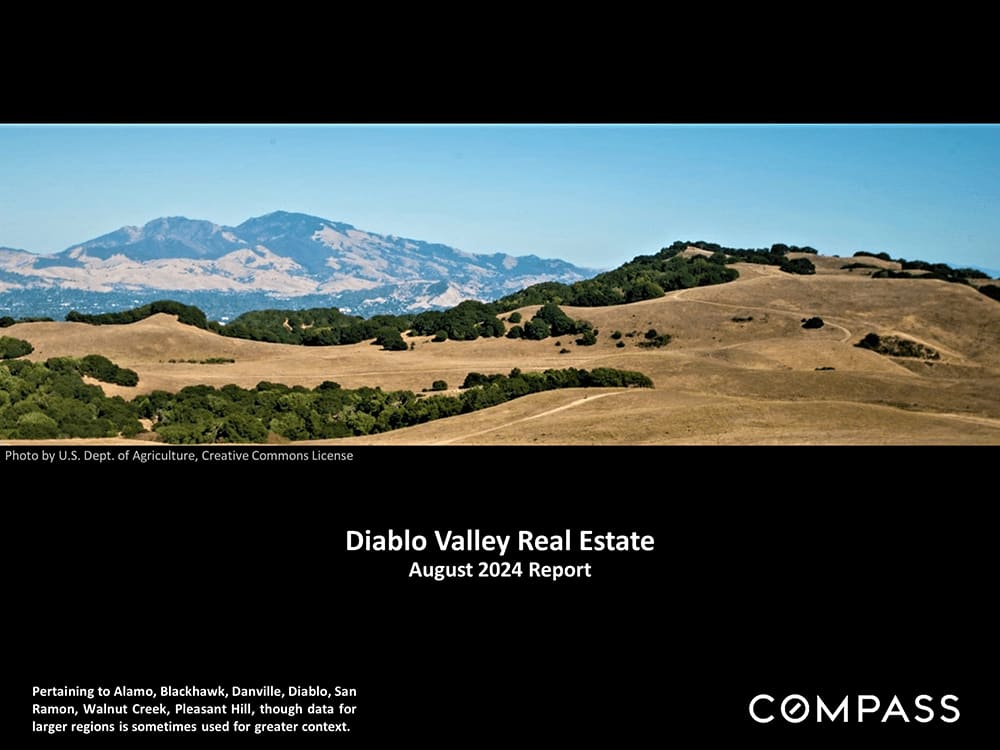
Diablo Valley Real Estate August 2024 Report
 
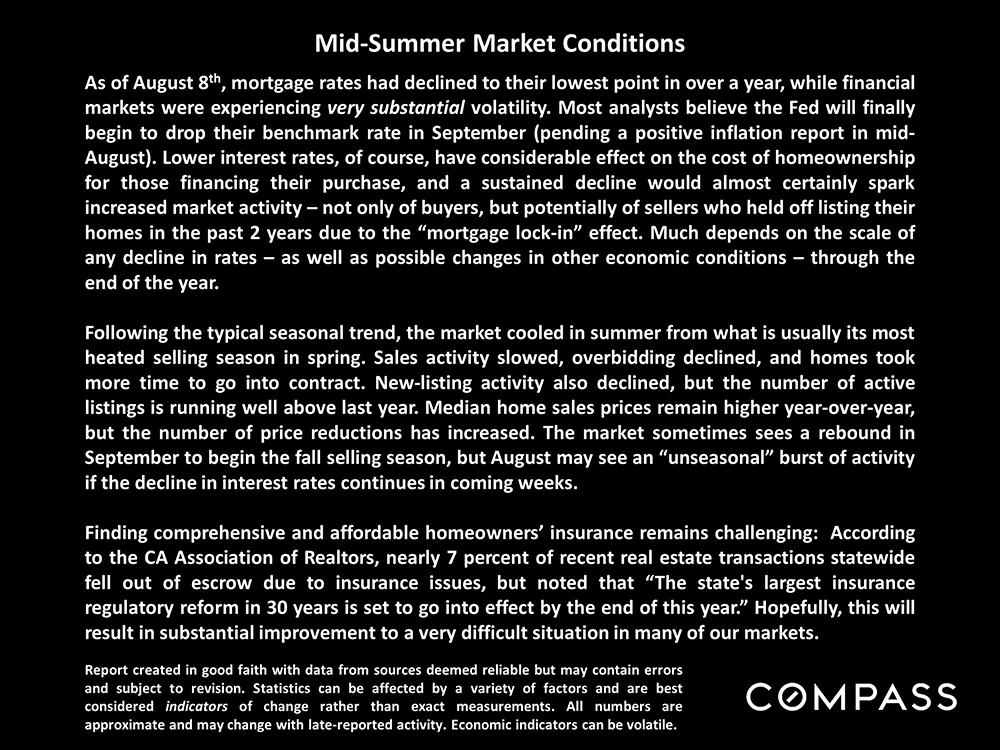
August 2024 market report on mortgage rates, seasonal housing activity, and homeowners’ insurance challenges.
 
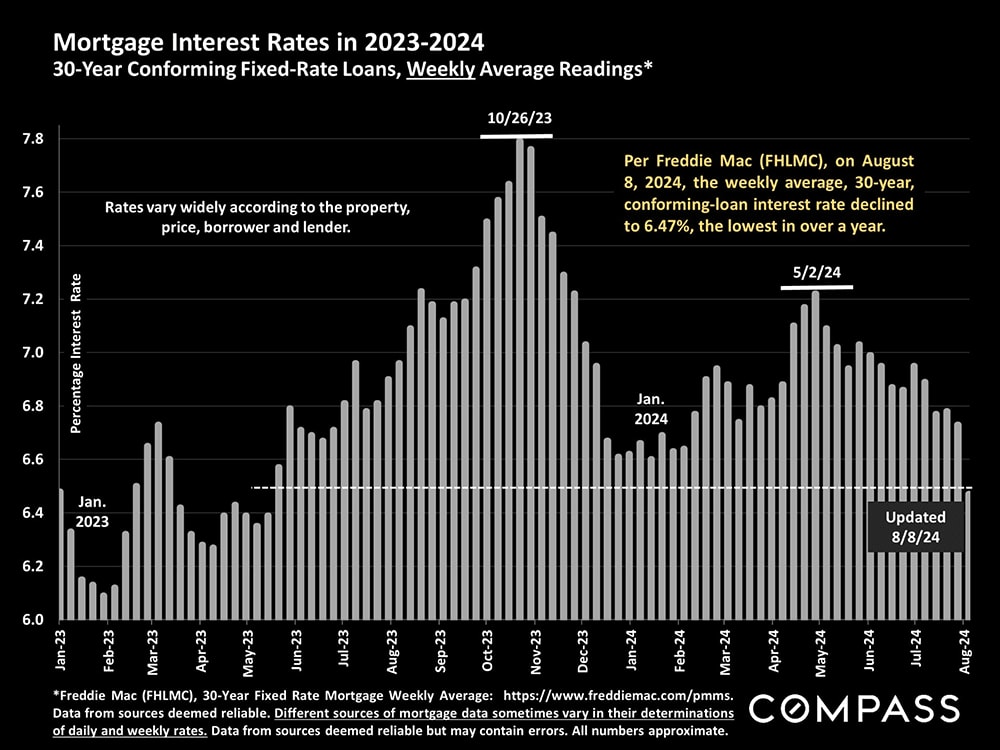
Bar chart of weekly 30-year mortgage rates from January 2023 to August 2024, peaking near 7.8% in October 2023.
 
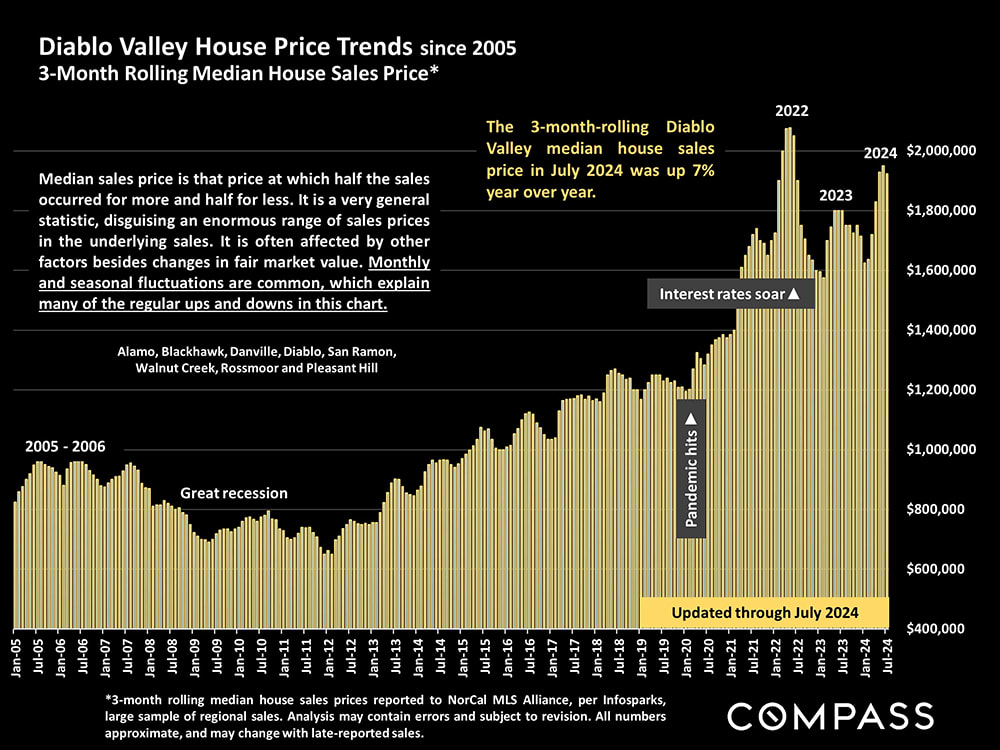
Chart of Diablo Valley median house prices from 2005 to July 2024, highlighting a 7% year-over-year rise.
 
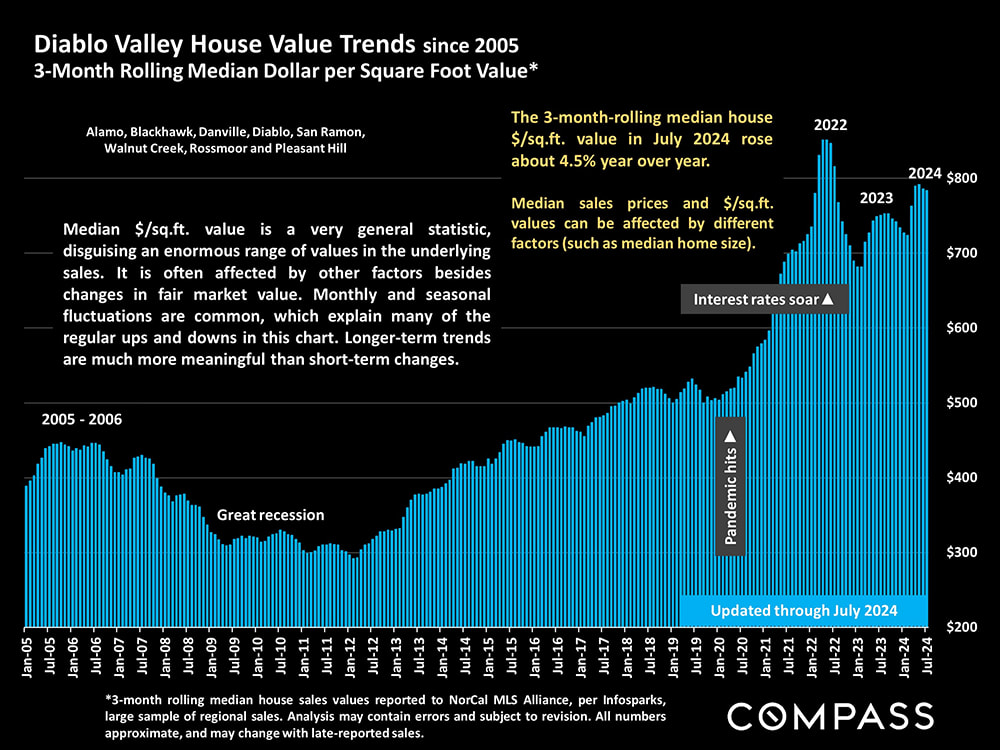
Diablo Valley home-value chart shows median price per square foot from 2005 through July 2024.
 
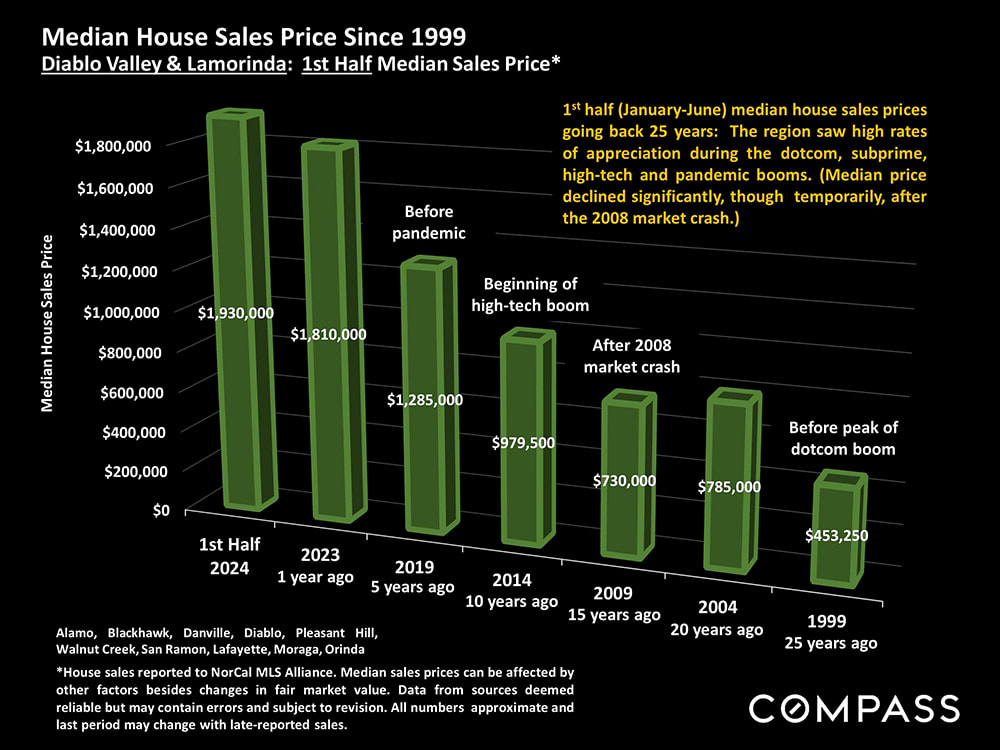
Bar chart of Diablo Valley and Lamorinda first-half median house prices, rising from $453,250 in 1999 to $1.93 million in 2024.
 
Bar chart comparing median home price appreciation in Diablo Valley and Lamorinda from 1999 to 2023.
 
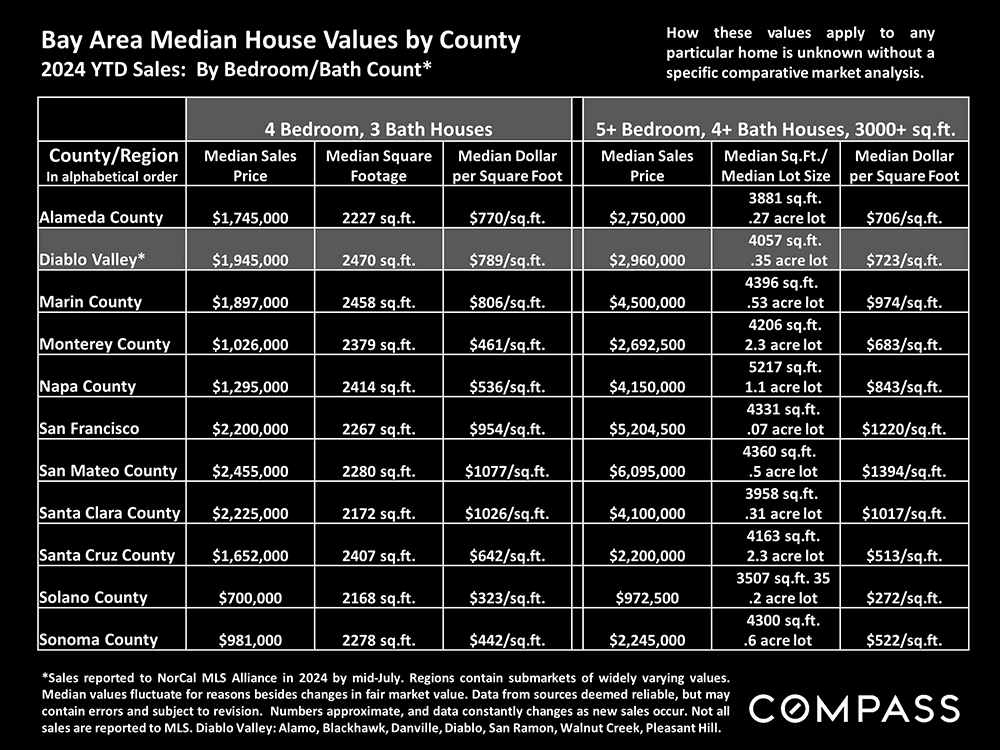
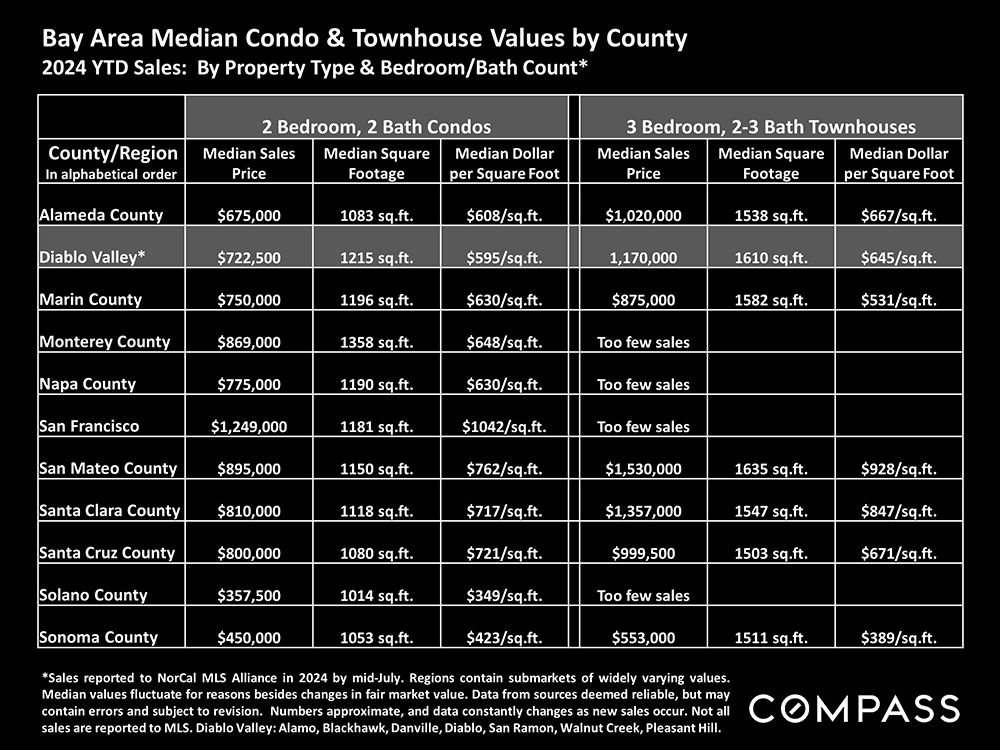
Bay Area county home value comparison chart with median prices and square-foot data for two home categories.
 
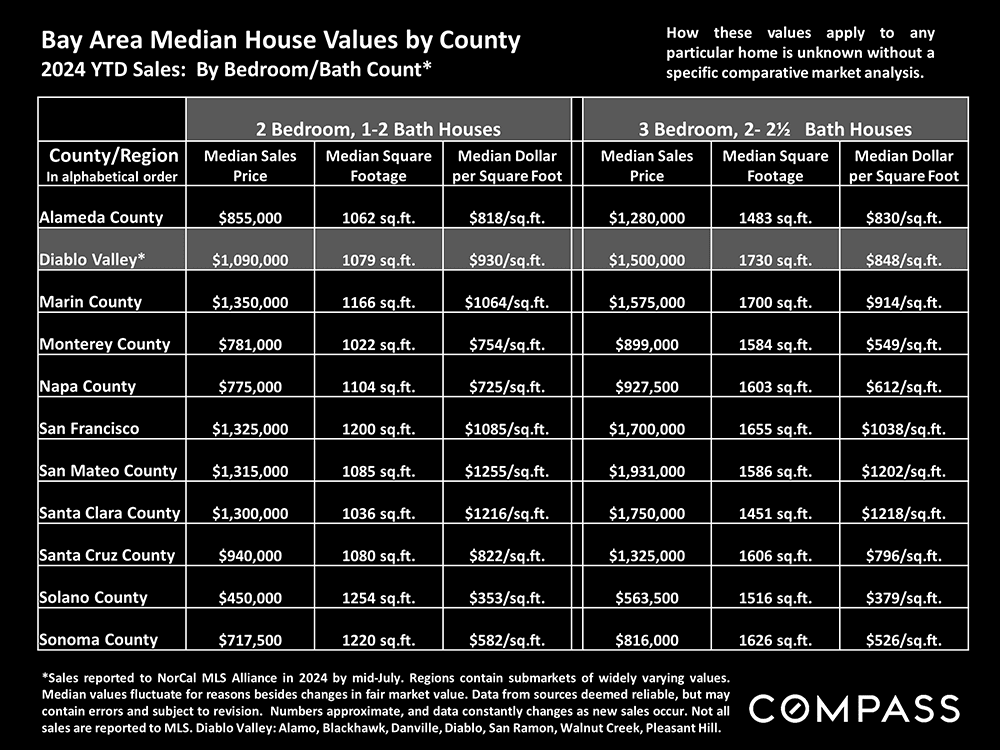
Bay Area 2024 median home prices, square footage, and price per square foot by county and bedroom count.
 
Bay Area county comparison of 2024 condo and townhouse median prices, square footage, and price per square foot.
 
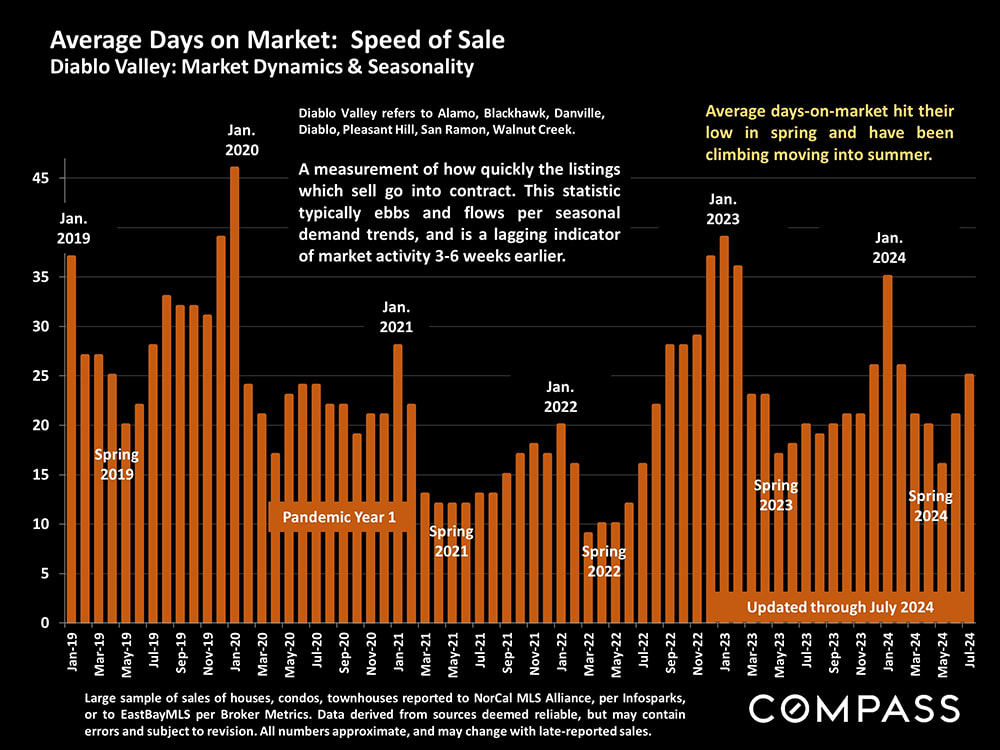
Bar chart of average days on market in Diablo Valley, January 2019 through July 2024.
 
Diablo Valley home sale prices versus original list prices, 2018–July 2024, peaking above 114% in spring 2022.
 
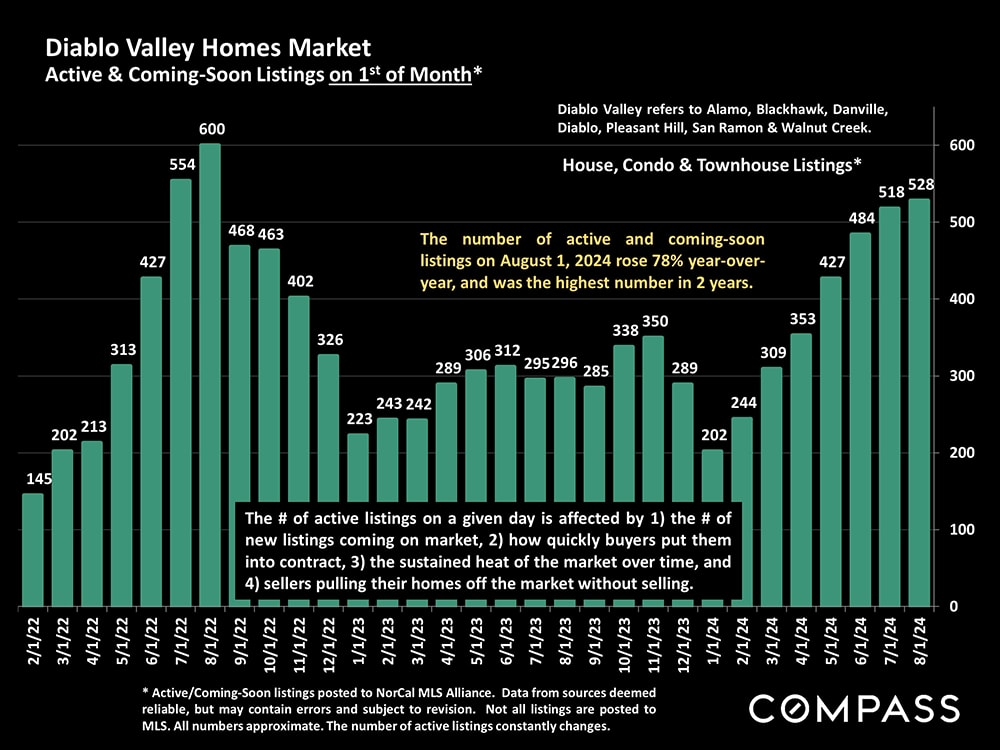
Bar chart of Diablo Valley active and coming-soon listings, rising to 528 in August 2024.
 
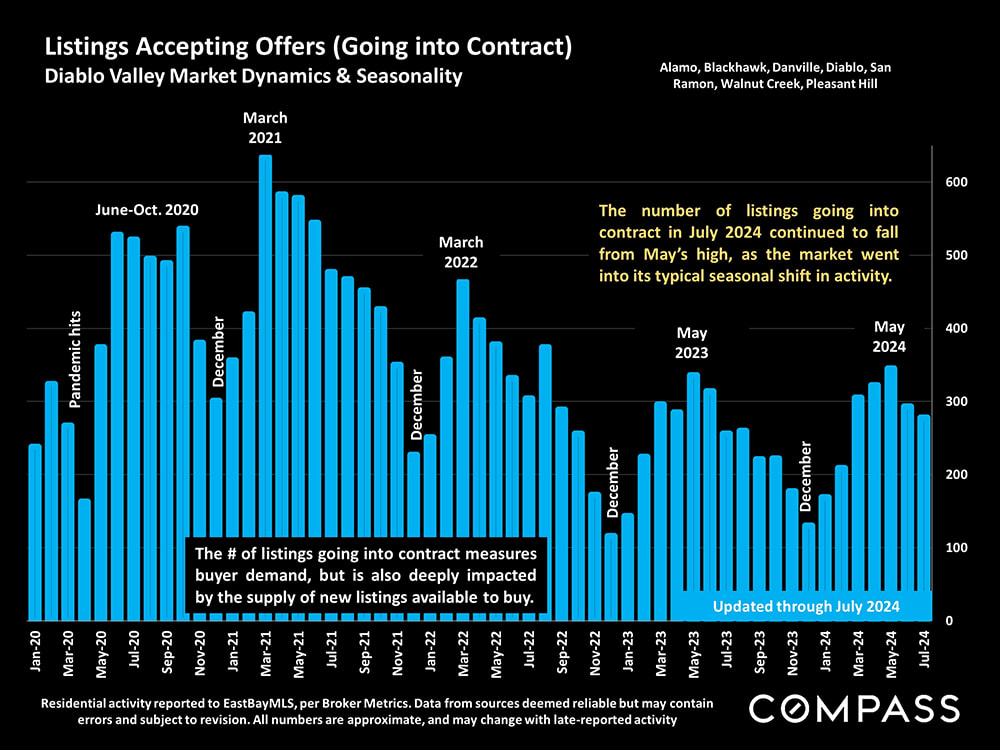
Bar chart of Diablo Valley listings going into contract, January 2020–July 2024, falling from a May 2024 peak.
 
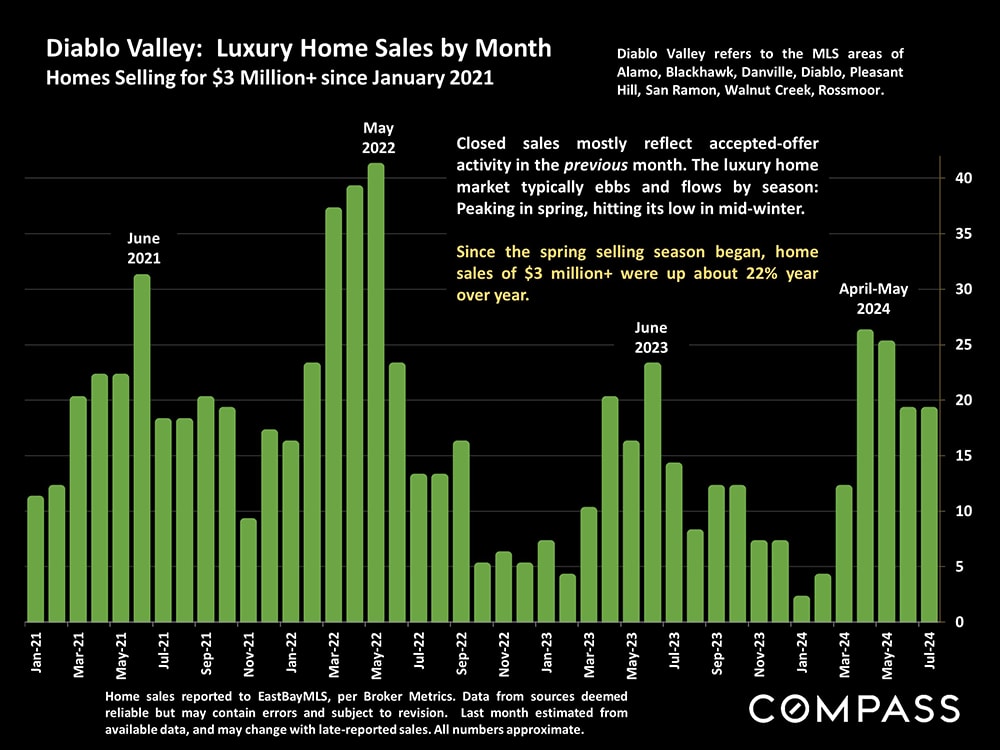
Chart of monthly Diablo Valley luxury home sales over $3 million, with the highest bar in May 2022.
 
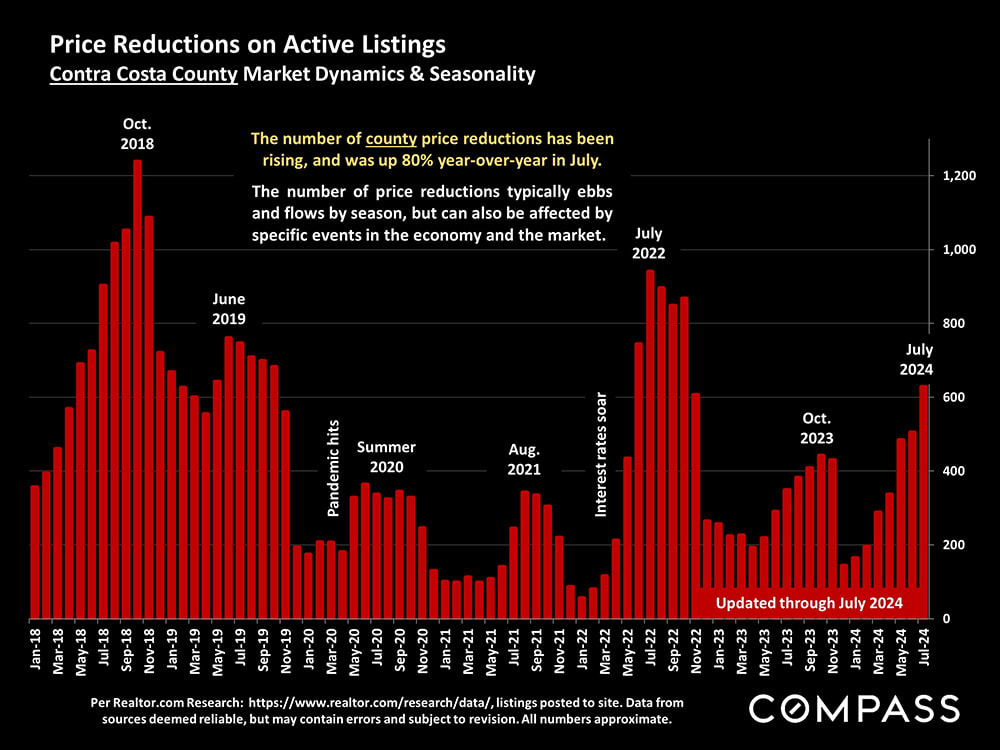
Contra Costa County active-listing price reductions by month, January 2018–July 2024, with market-event annotations.
 
Graphic promoting a report on 25-year appreciation rates in San Francisco Bay Area housing markets, with a satellite view of the region.
 
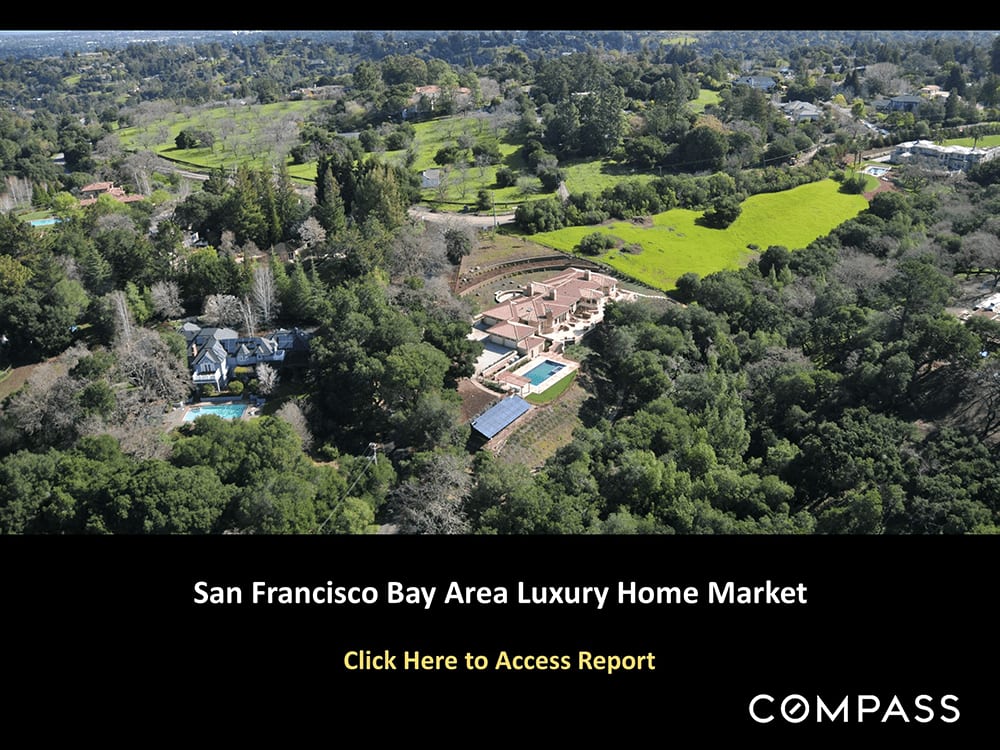
San Francisco Bay Area luxury home market report promotion with an aerial view of homes and a report link.
 
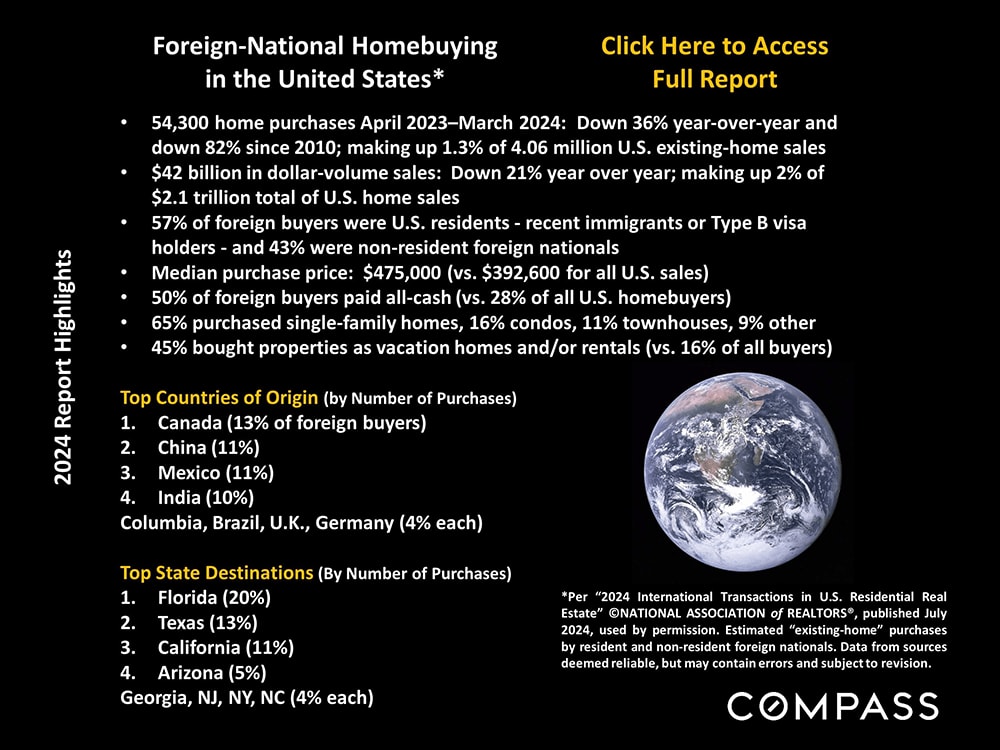
Infographic summarizing 2024 foreign-national homebuying, including buyer statistics, top countries of origin, and destination states.
 
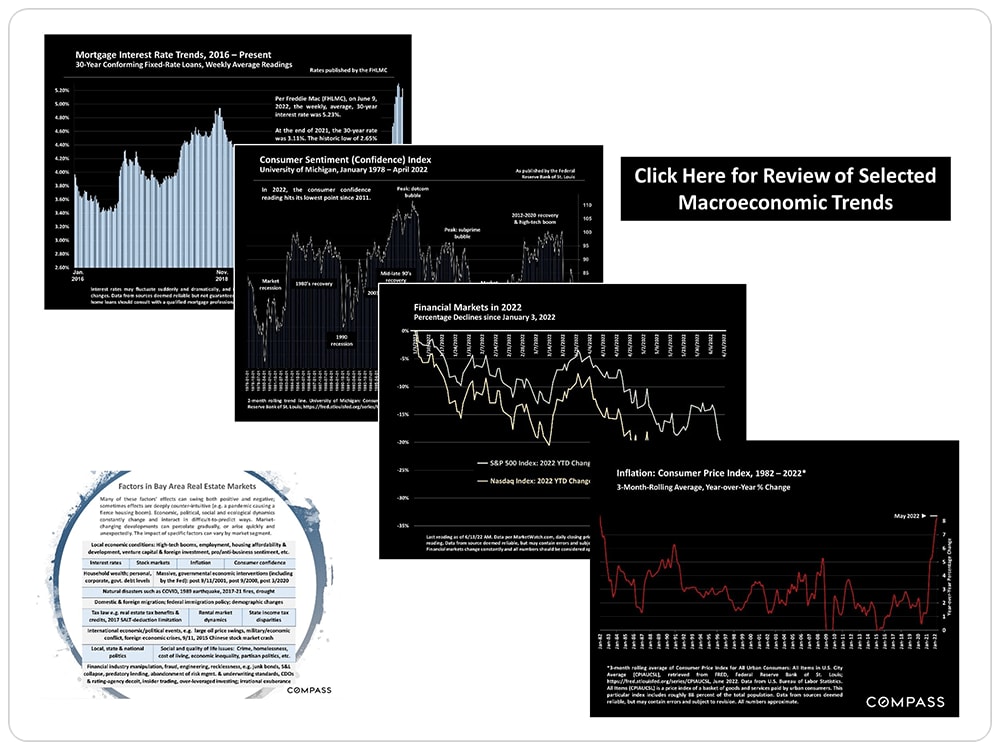
Macroeconomic charts on mortgage rates, consumer sentiment, financial markets, inflation, and Bay Area real estate factors.

Work With Us

As the real estate experts in the Danville and Blackhawk areas, our team is committed to exceeding our client’s expectations, focusing on their best interests, and creating long-term relationships. We tirelessly do what it takes to list properties and get the desired results on both sides of the deal.

Follow Me on Instagram