// Paste into your site-wide header field. // Only injects schema on /agent/joujou-chawla — no other page is affected.
Happy St. Patrick’s Day 2024

Happy St. Patrick’s Day 2024

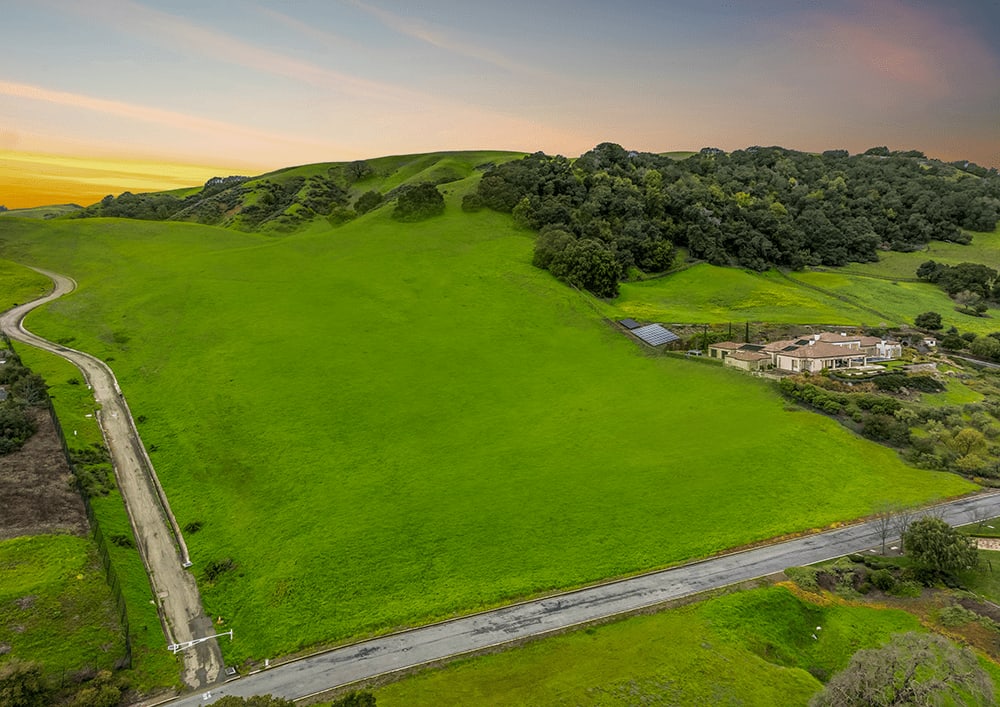
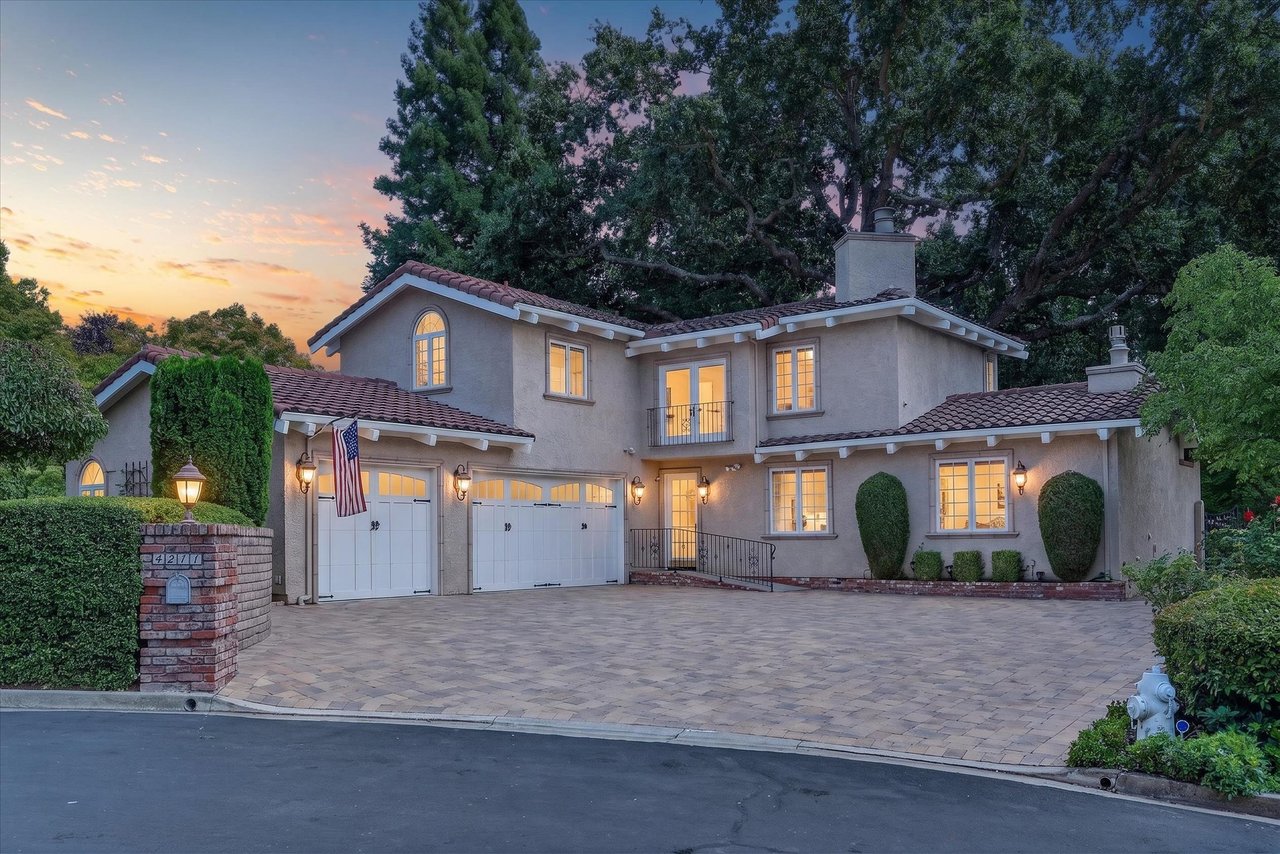
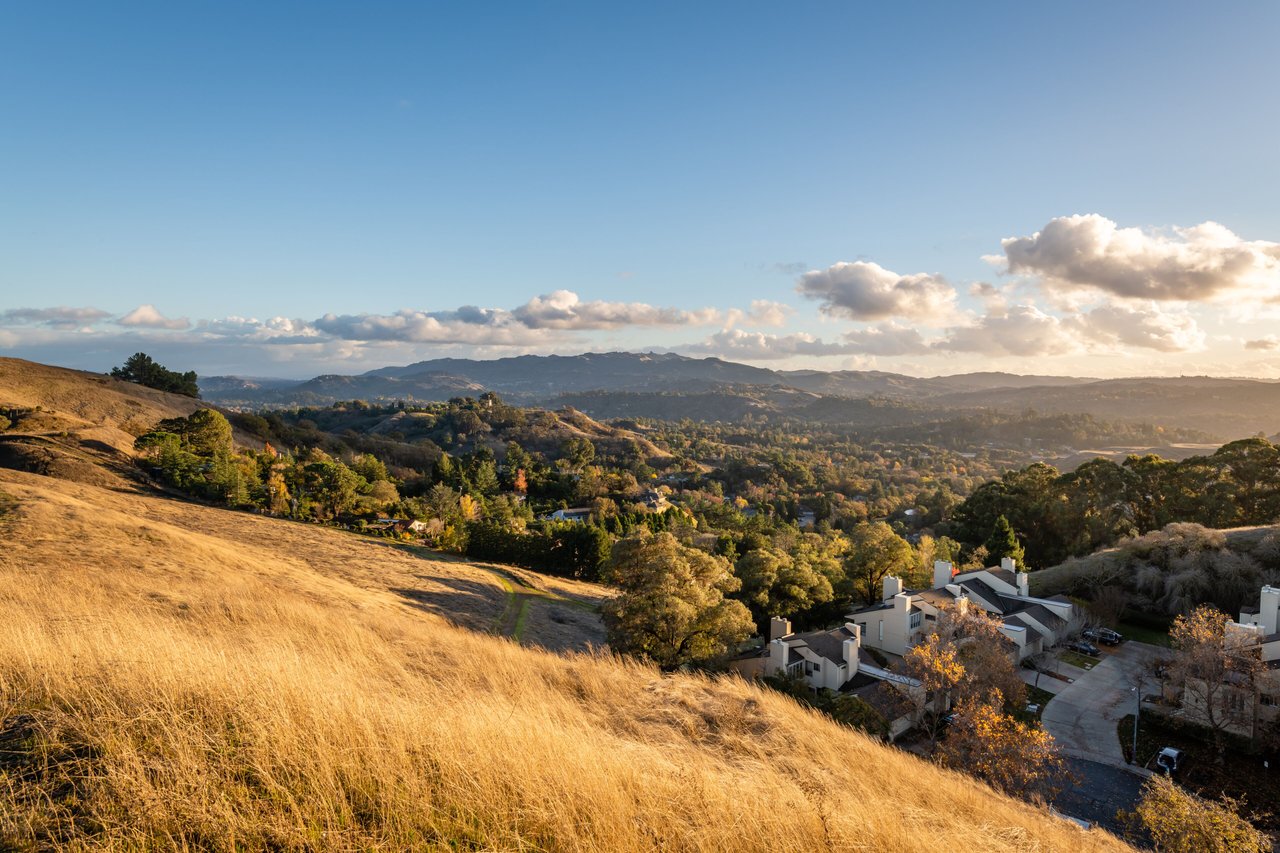
Aerial view of a green property with a home beside wooded rolling hills at sunset.
 

Happy St. Patrick’s Day!

Joujou Chawla / Compass
 
“The best luck of all is the luck you make for yourself.”
 
- Douglas MacArthur
 
If you have any questions, please do not hesitate to reach out.



Joujou Chawla standing in a red patterned jacket in an entryway.
 
Latest News from Joujou
 
Faces of the East Bay 2024
 

Proud to be named the face of Real Estate for both Blackhawk and Danville by Diablo Magazine!

Click here for Blackhawk

Click here for Danville

Market update banner.
 
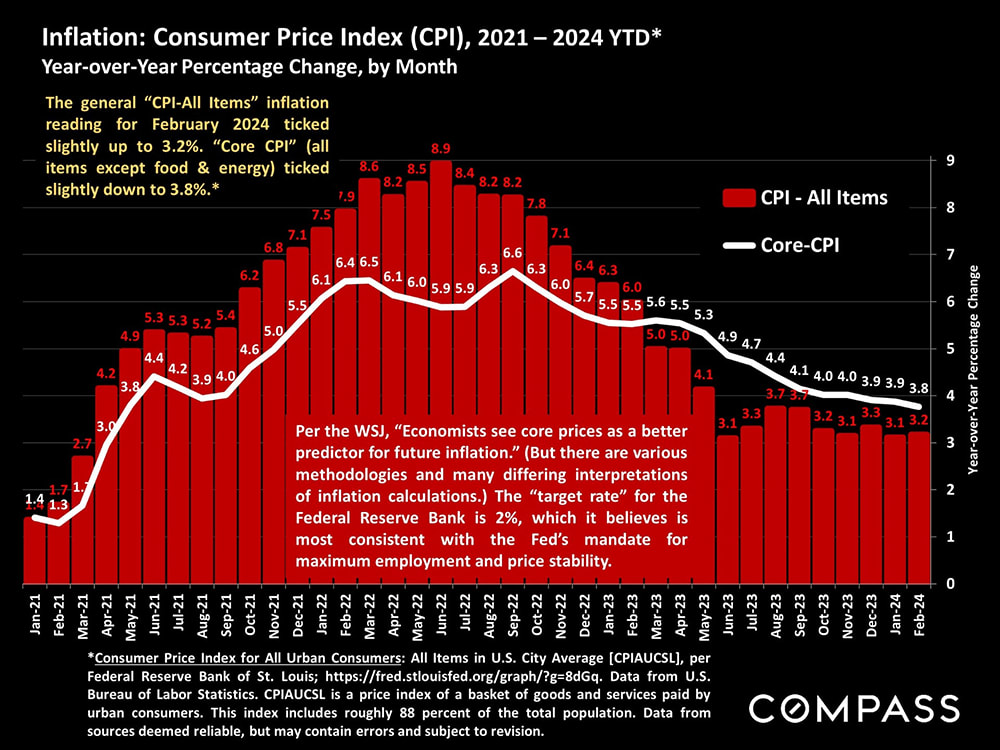
Chart comparing monthly CPI-All Items inflation and Core-CPI from January 2021 through February 2024.
 
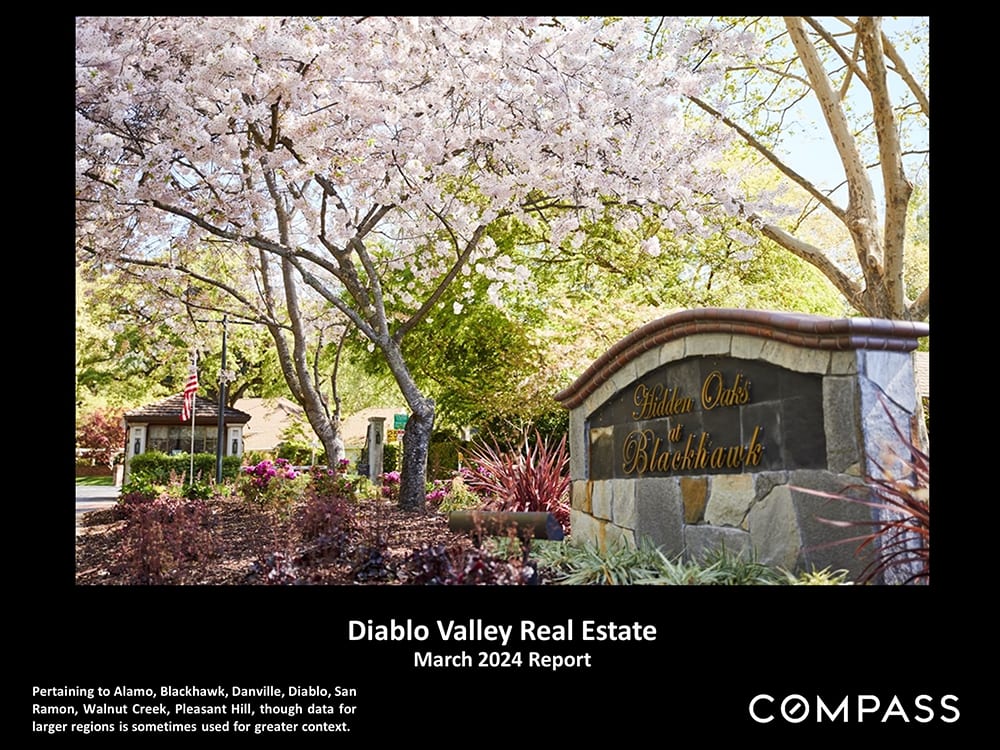
March 2024 Diablo Valley Real Estate report cover featuring the Hidden Oaks at Blackhawk entrance beneath flowering trees.
 
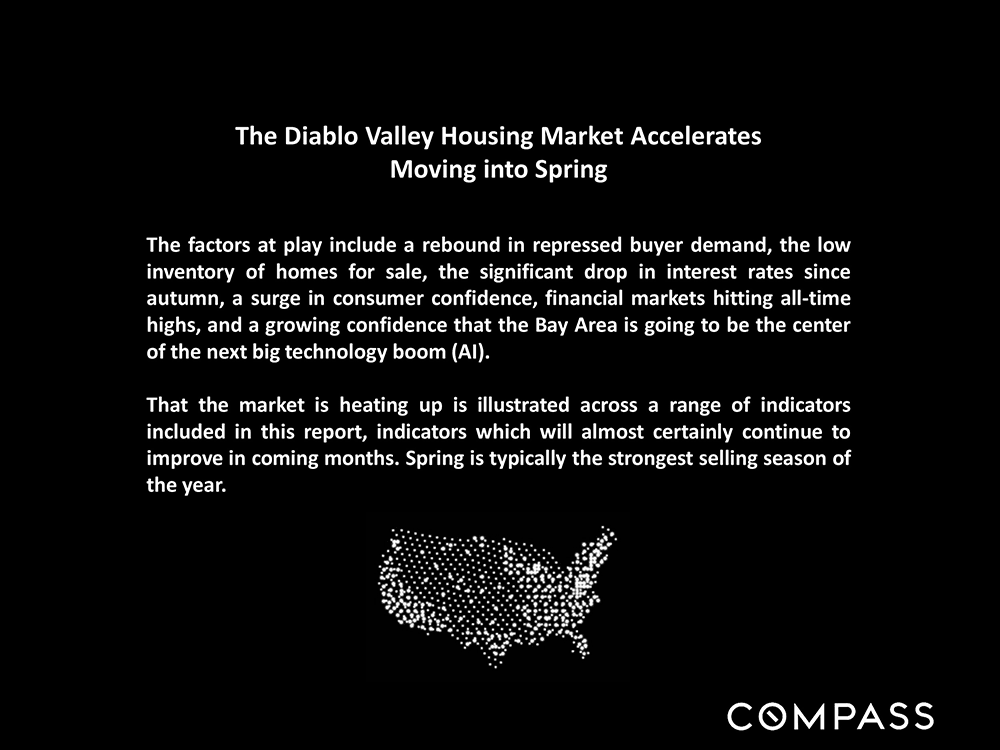
Diablo Valley housing market report on spring acceleration, with a dotted U.S. map and Compass branding.
 
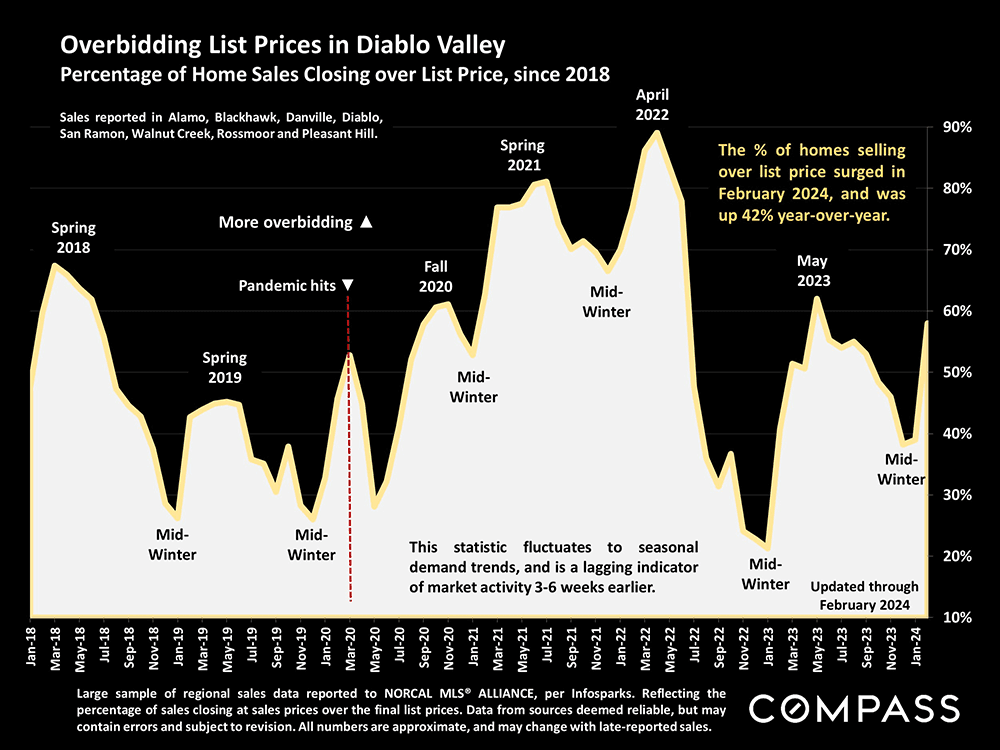
Chart of Diablo Valley home sales closing over list price, from 2018 to 2024, with seasonal peaks and a 2024 surge.
 
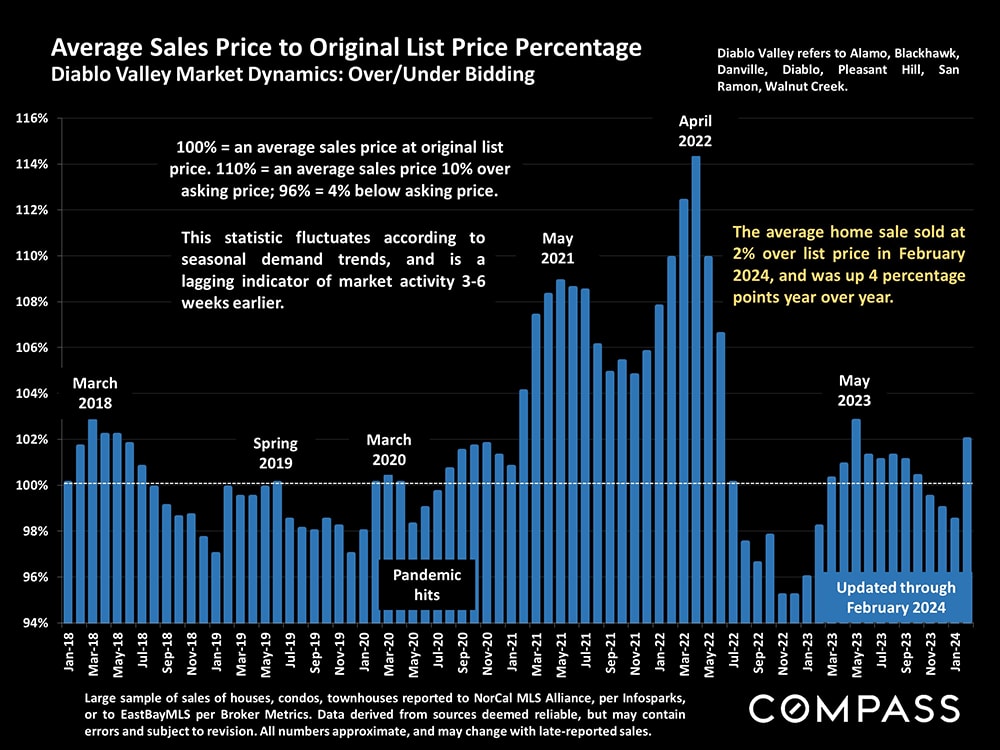
Diablo Valley home sale price chart, with monthly results from 2018 to February 2024 and a 2022 peak.
 
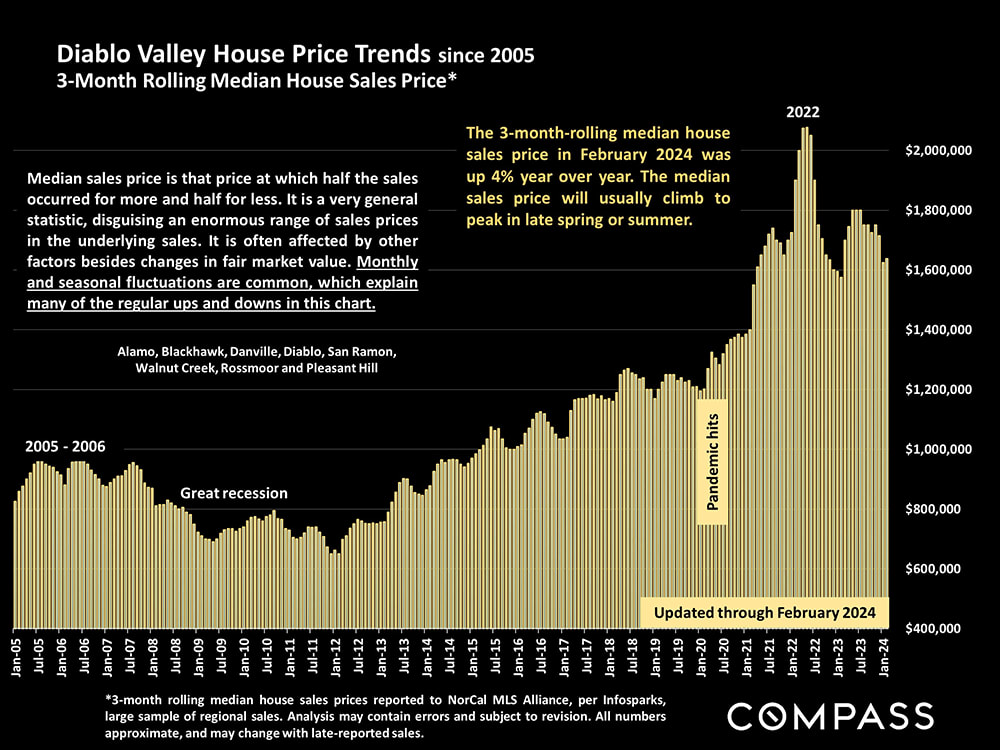
Chart of Diablo Valley median house prices from 2005 to 2024, with a peak above $2 million in 2022.
 
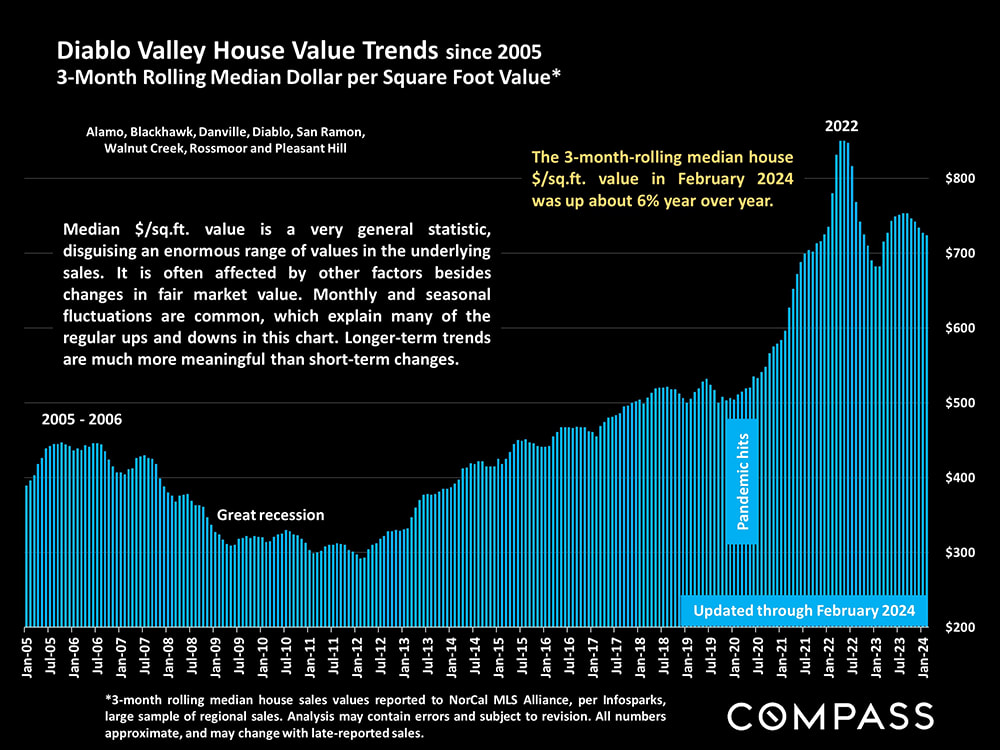
Chart of Diablo Valley median home value per square foot from 2005 to February 2024, with a 6% year-over-year increase noted.
 
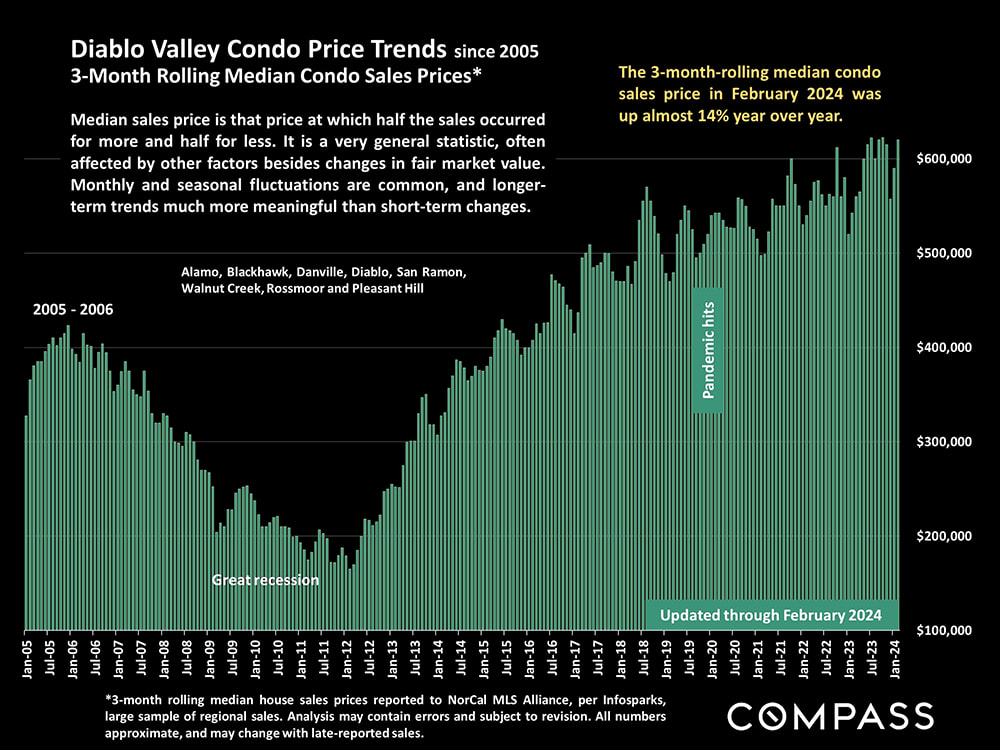
Bar chart of Diablo Valley condo prices, 2005–2024, with recession and pandemic markers.
 
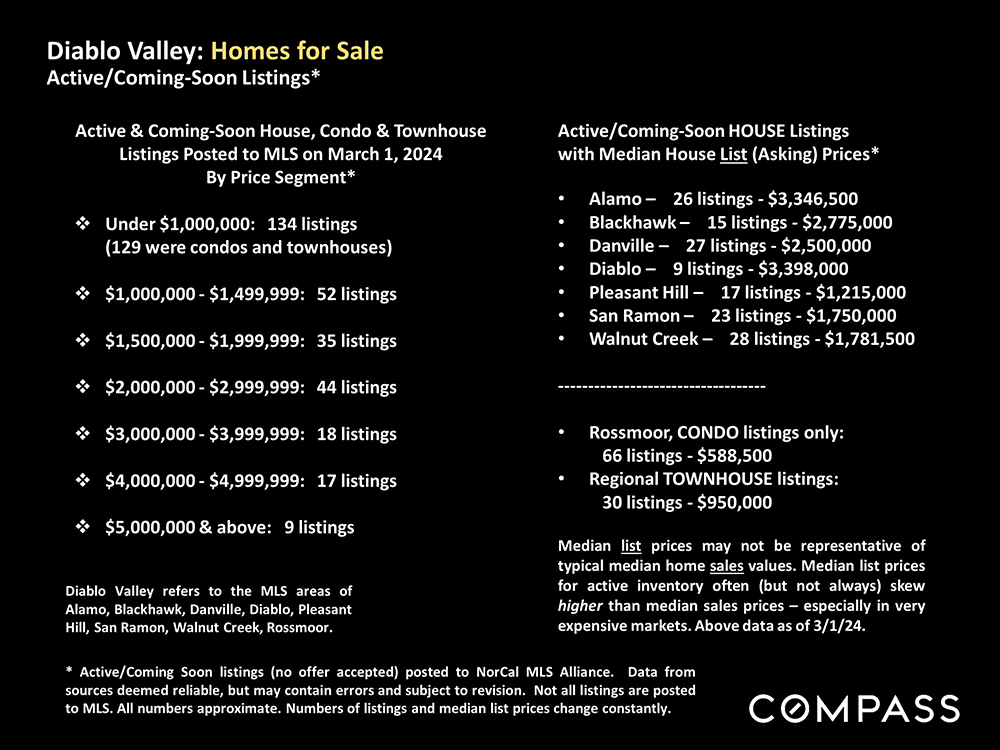
Diablo Valley active and coming-soon real estate listings infographic with price segments and local median asking prices.
 
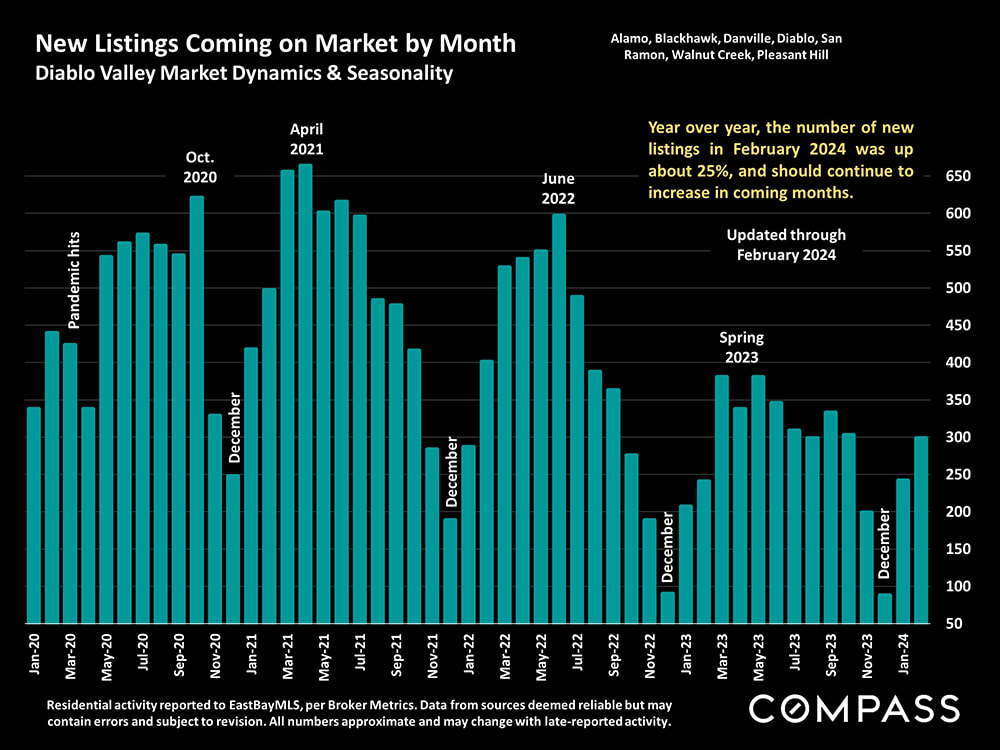
Diablo Valley monthly new-listing chart, January 2020–January 2024, with peaks in April 2021 and June 2022.
 
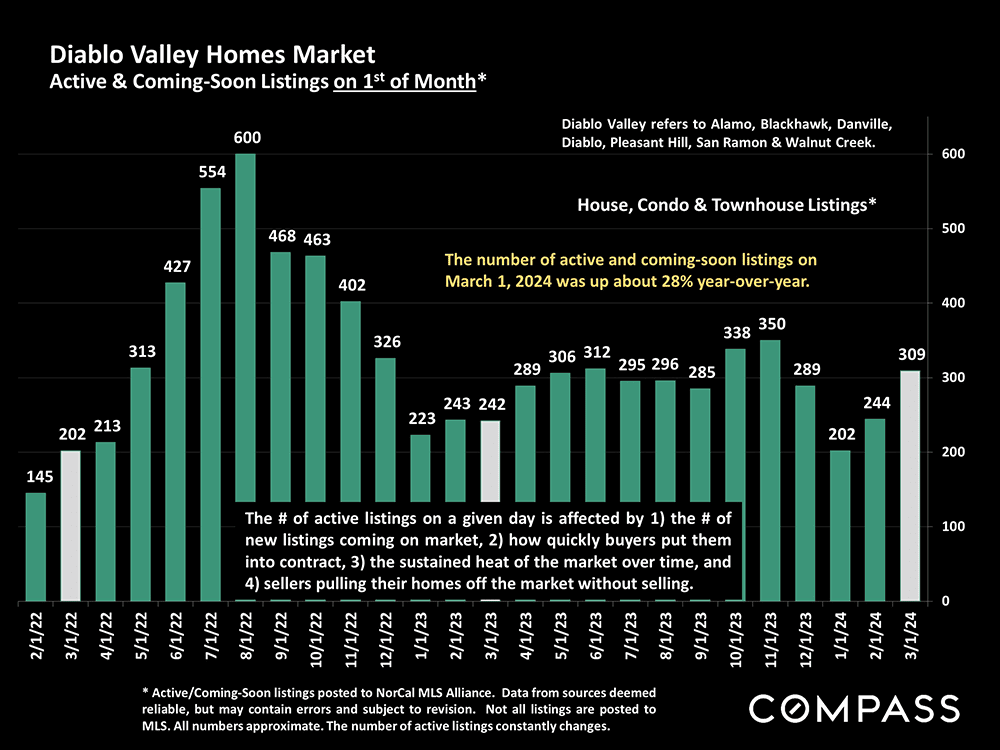
Bar chart of Diablo Valley home listings, showing 309 active and coming-soon listings on March 1, 2024.
 
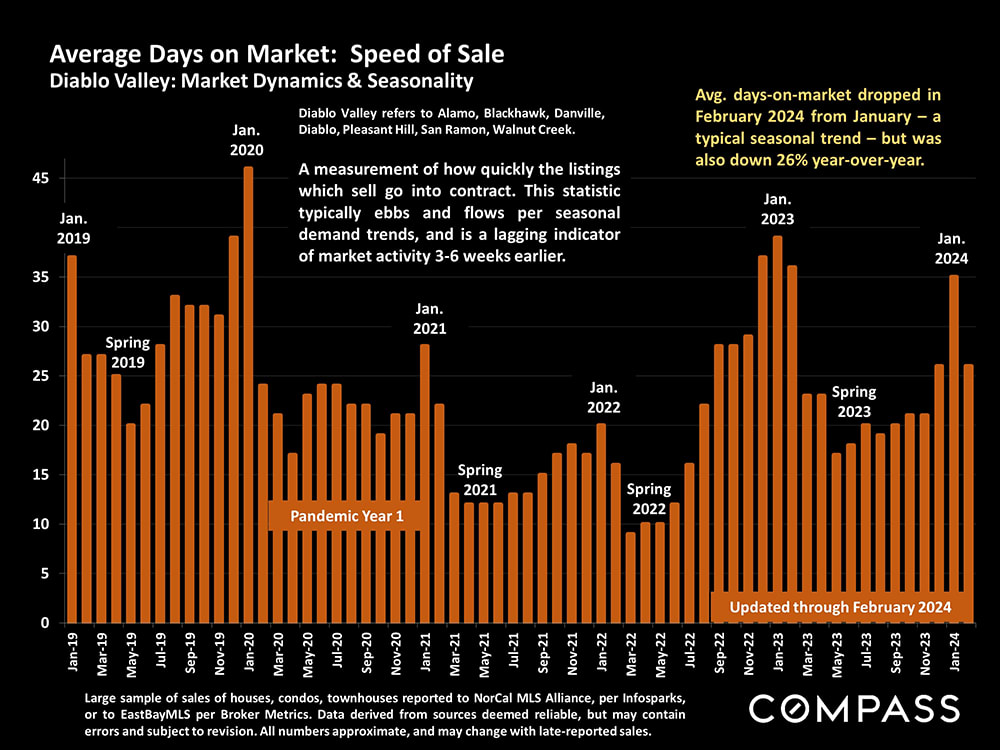
Chart of Diablo Valley average days on market, with monthly orange bars from 2019 to 2024 and seasonal annotations.
 
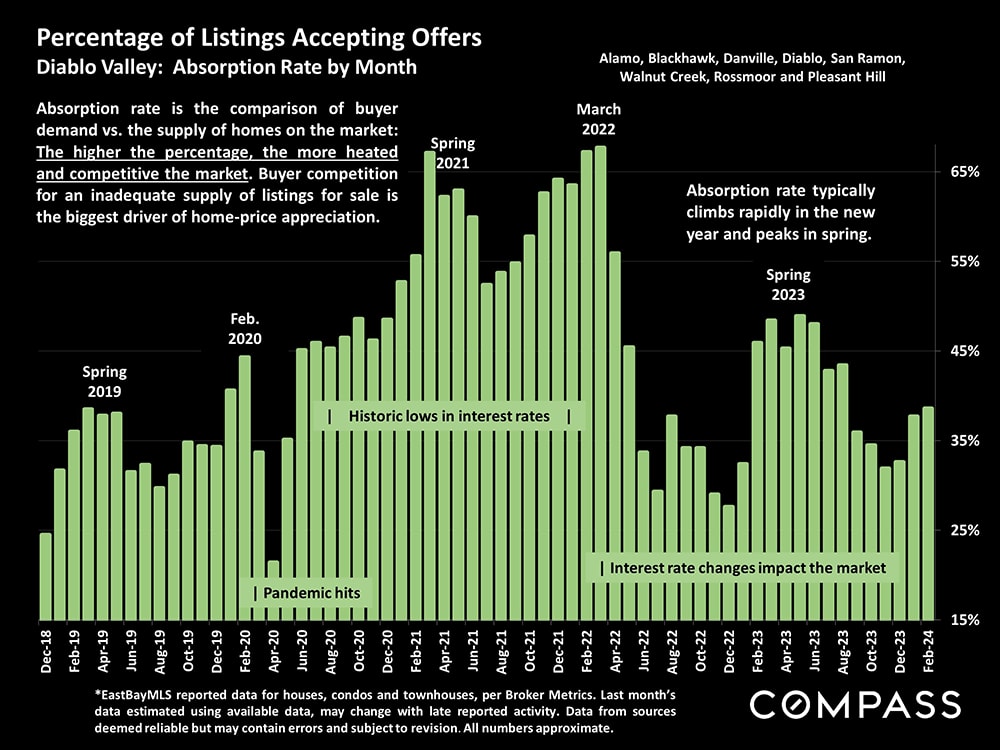
Diablo Valley monthly absorption-rate chart, with green bars from December 2018 to February 2024 and market annotations.
 
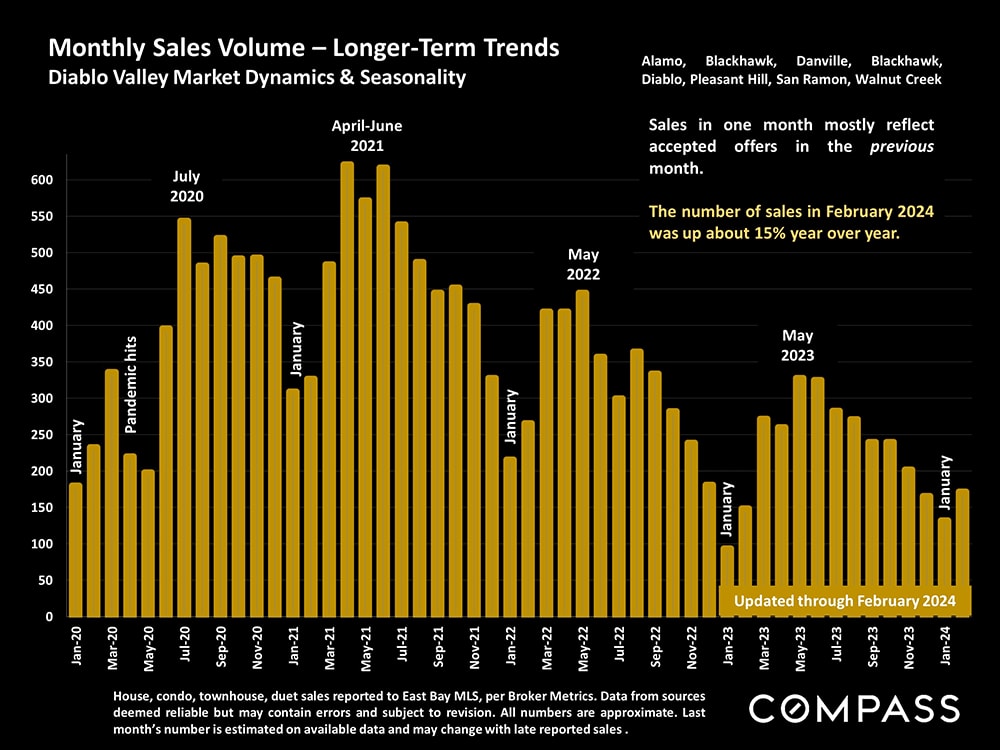
Diablo Valley monthly home sales chart, January 2020–February 2024, with gold bars and a February 2024 year-over-year note.
 
Infographic on factors behind declining home listings, with a dotted U.S. map and Compass branding.
 
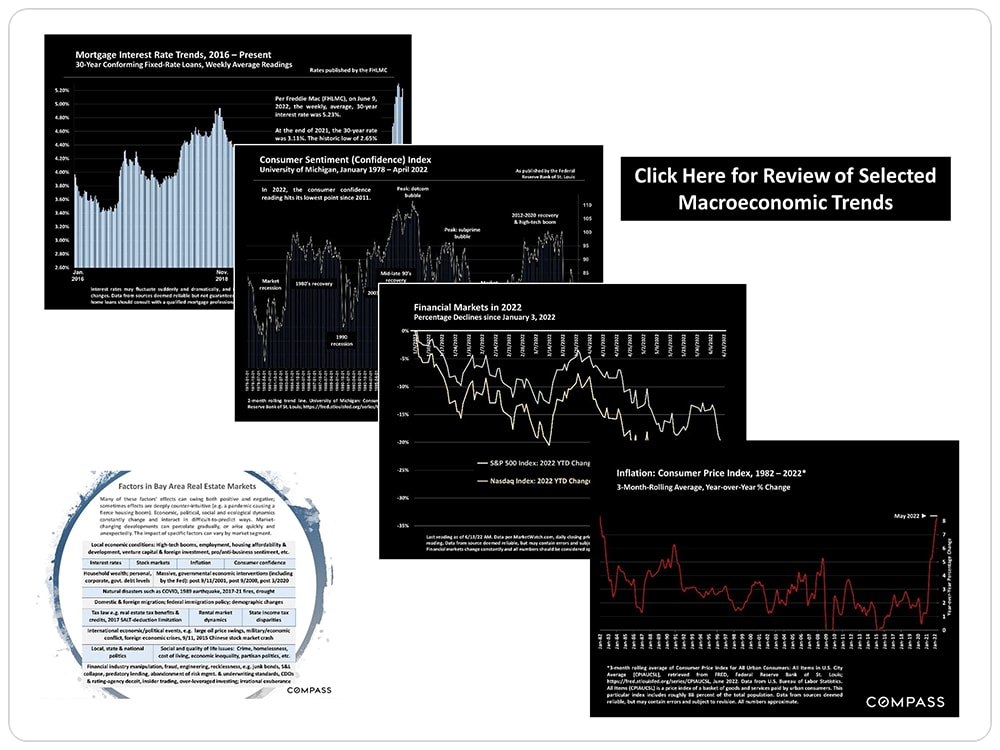
Charts of mortgage rates, consumer sentiment, financial markets and inflation alongside Bay Area real estate market factors.
 
A hand holds a small green shamrock against a softly blurred garden background.
 
Please let me know if I can ever be of assistance, in any way, to you or your family, friends, and colleagues.
Work With Us

As the real estate experts in the Danville and Blackhawk areas, our team is committed to exceeding our client’s expectations, focusing on their best interests, and creating long-term relationships. We tirelessly do what it takes to list properties and get the desired results on both sides of the deal.

Follow Me on Instagram