// Paste into your site-wide header field. // Only injects schema on /agent/joujou-chawla — no other page is affected.
Q2 May See Hottest Market

Q2 May See Hottest Market

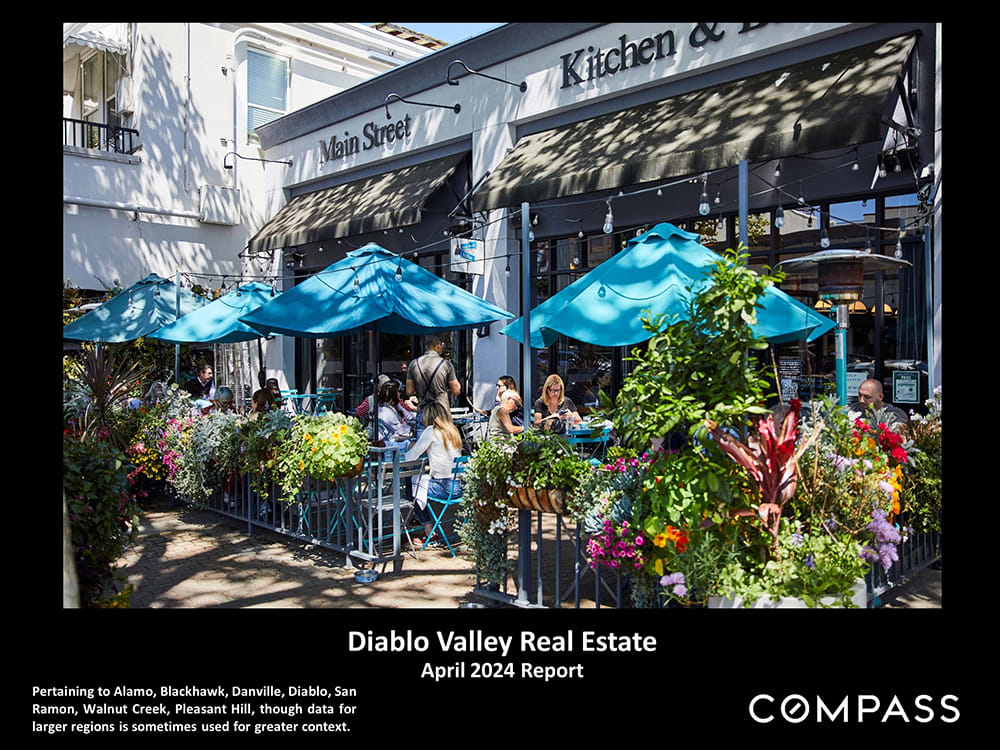
Diablo Valley Real Estate April 2024 Report, featuring a restaurant patio with turquoise umbrellas and flowers.
 

Q2 May See the Hottest Market Since the Peak of the Pandemic

Joujou Chawla and Compass
 
Ever since the beginning of the year, and now moving into the spring selling season, striking shifts in supply and demand have occurred and continued to accelerate, resulting in a dramatic leap in the heat and competitiveness of market conditions. Based on current indicators illustrated in this report, and what is being experienced on the ground as new listings arrive on the market, deals are negotiated, and homes go into contract, it appears almost certain that significant home price increases will begin to show up in Q2 2024.
 
If you have any questions, please do not hesitate to reach out.

 
(510) 406-4836
 
joujou.chawla@chawlarealestate.com
 
Joujou Chawla in glasses and a red patterned jacket, pictured beside her handwritten sign-off.
 
Market Update
 
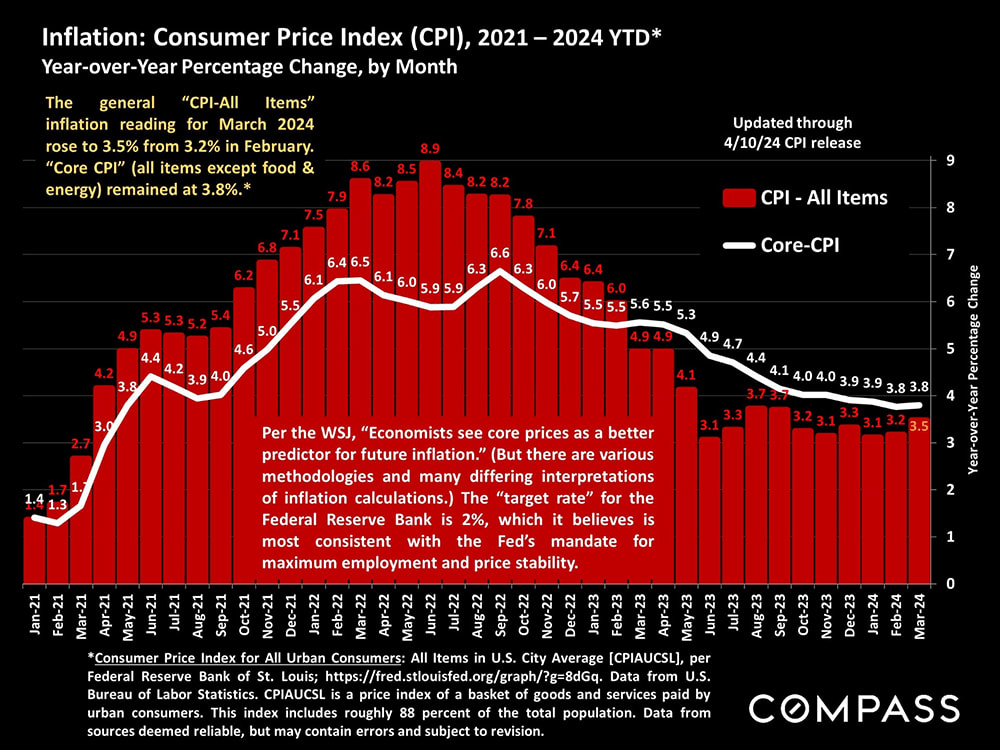
Chart of monthly CPI and core CPI changes from 2021 to March 2024, with red bars and a white trend line.
 
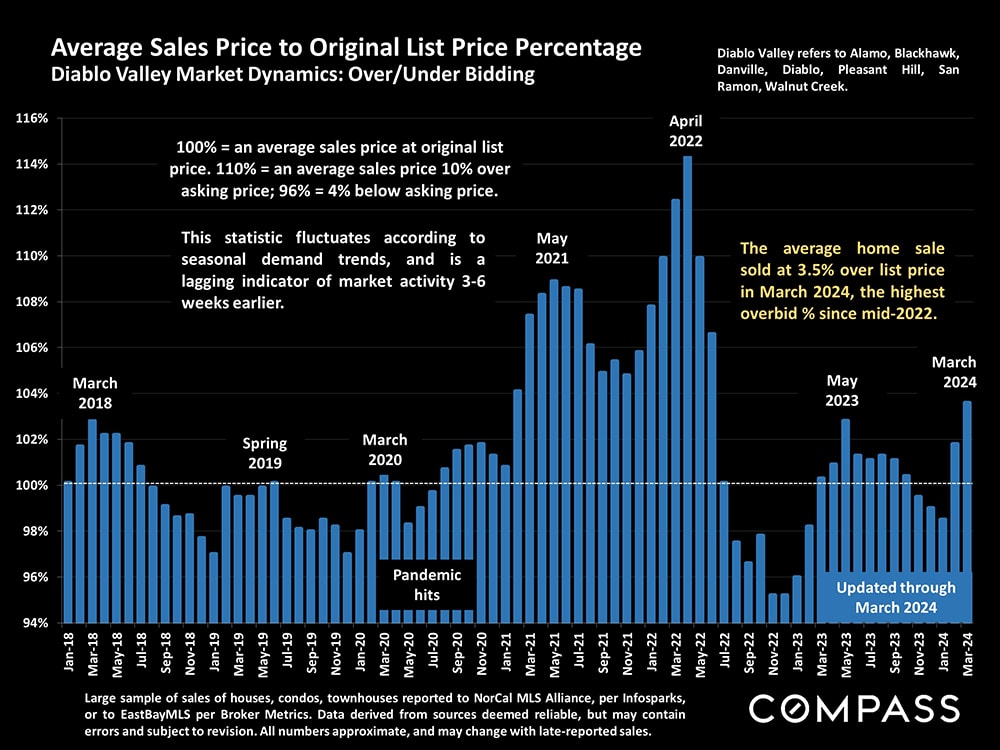
Diablo Valley list-price bidding chart, with monthly sales-price percentages from 2018 to March 2024.
 
Diablo Valley monthly absorption-rate bar chart, with market milestones from 2018 through early 2024.
 
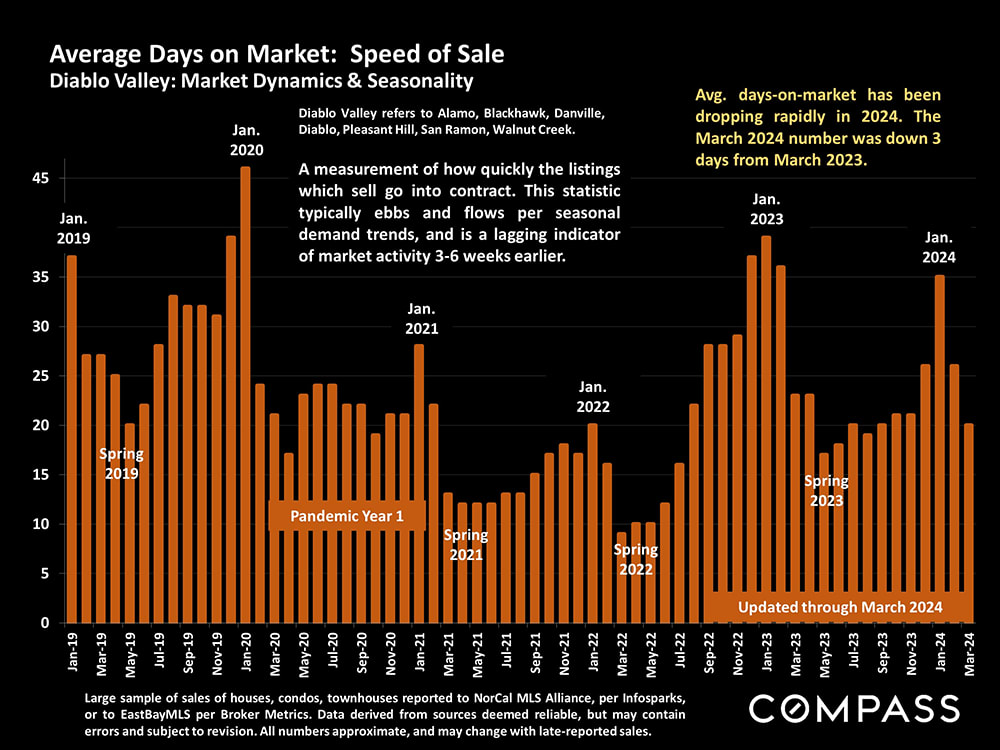
Diablo Valley average days-on-market chart, with monthly orange bars from 2019 to March 2024.
 
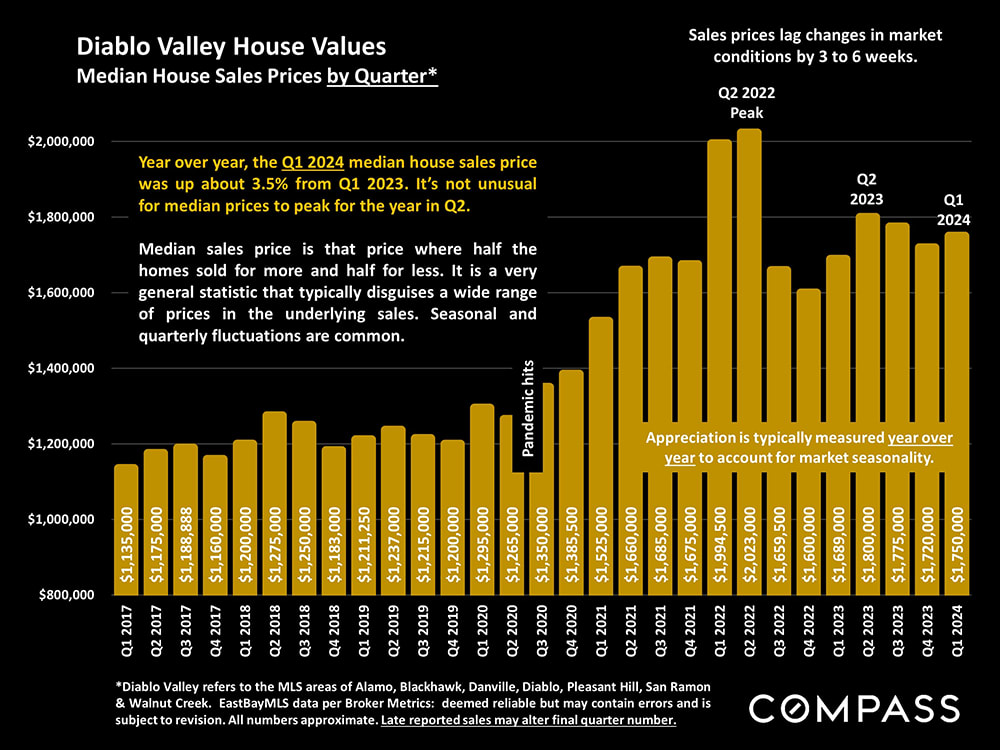
Chart of Diablo Valley median home sale prices by quarter, showing a peak near $2 million in Q2 2022.
 
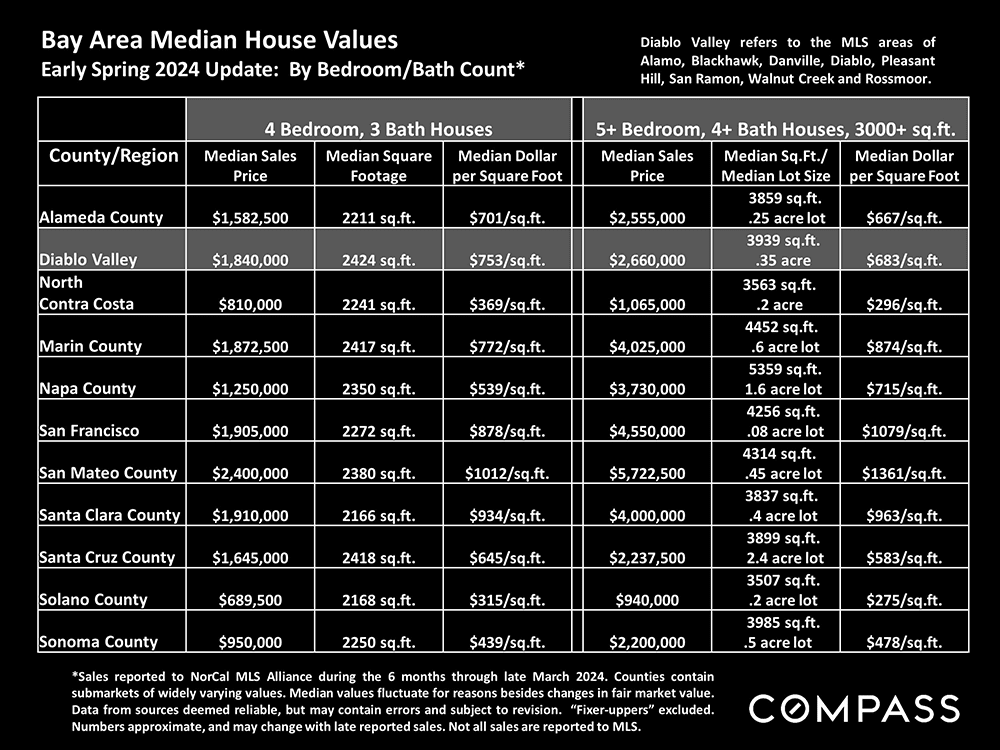
Bay Area median house value table comparing prices, sizes, and price per square foot across counties and regions.
 
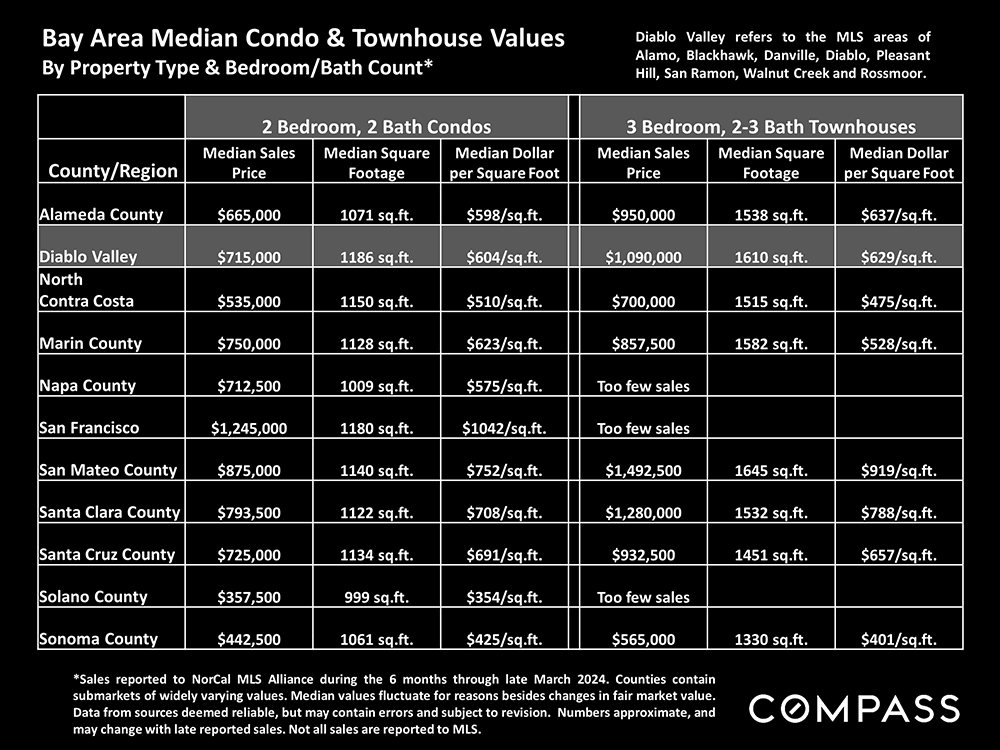
Chart comparing Bay Area condo and townhouse median prices, sizes, and prices per square foot by county.
 
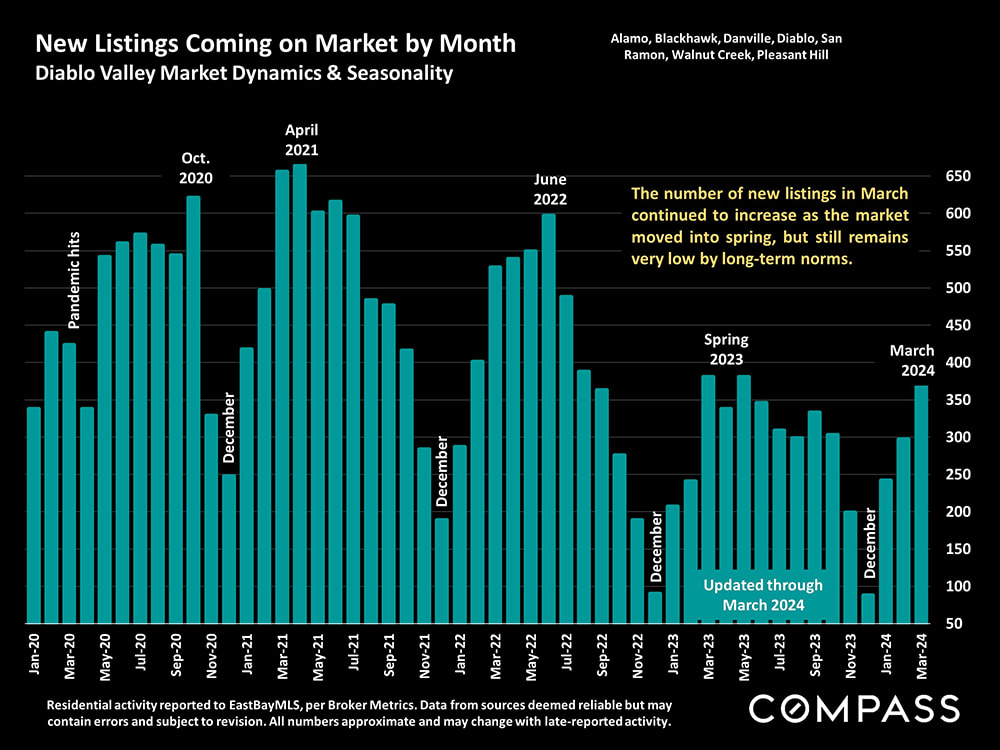
Bar chart of monthly Diablo Valley new listings, January 2020–March 2024, peaking in April 2021 and June 2022.
 
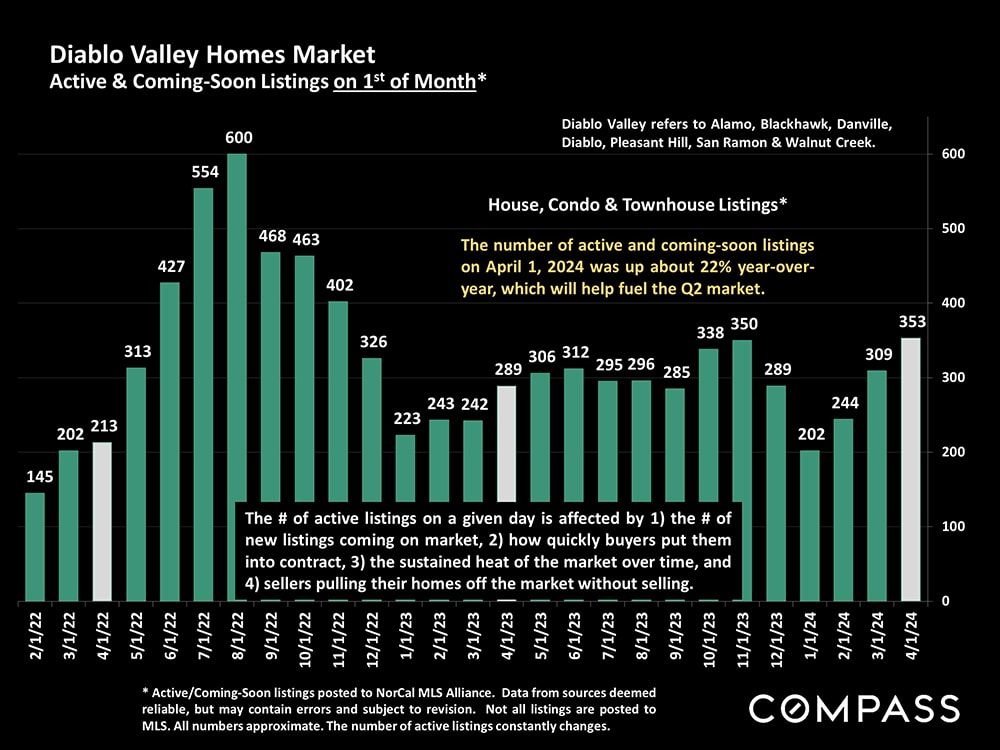
Bar chart of Diablo Valley active and coming-soon home listings from February 2022 to April 2024.
 
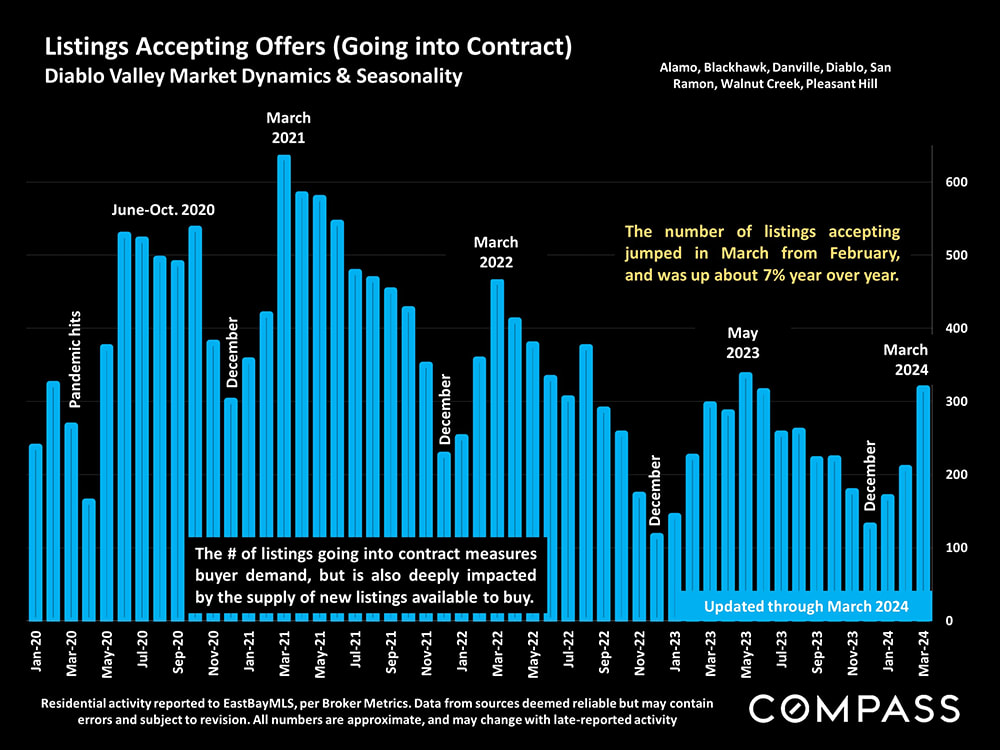
Diablo Valley chart of monthly listings entering contract, January 2020–March 2024.
 
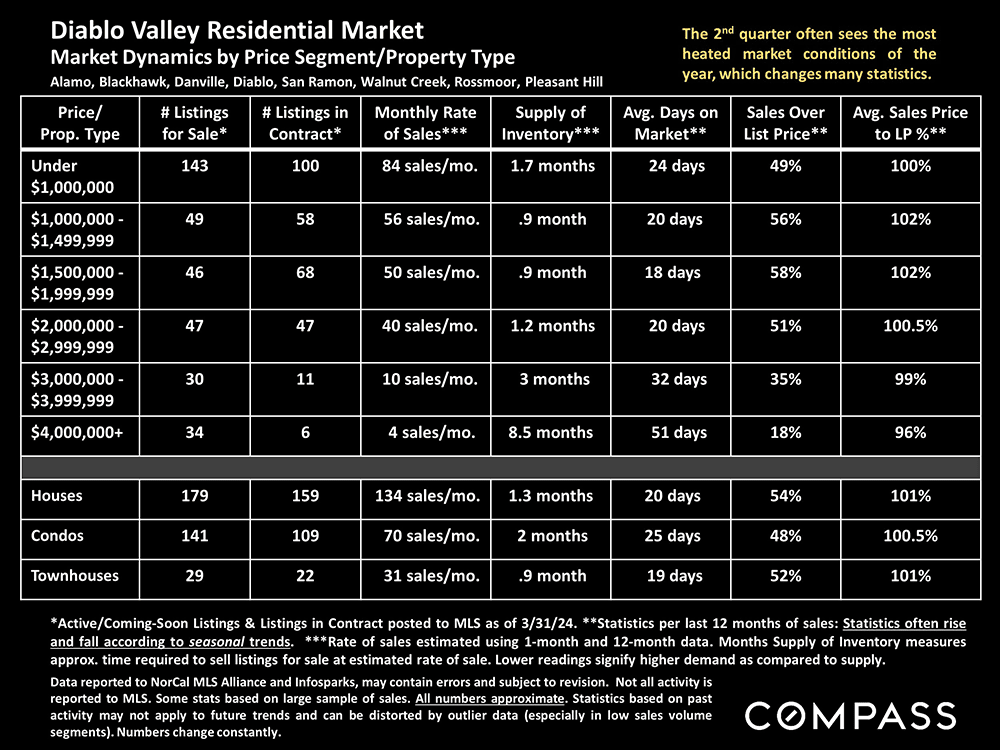
Diablo Valley residential market chart compares housing statistics by price range and property type.
 
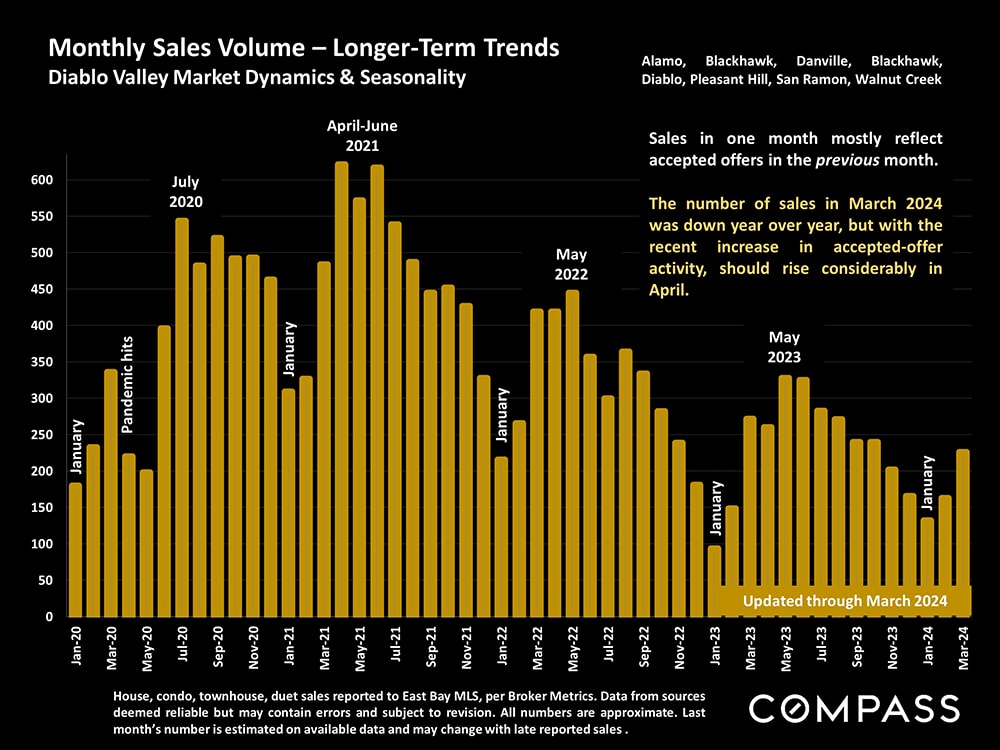
Diablo Valley monthly sales volume chart from January 2020 to March 2024, with market trend notes and Compass branding.
 
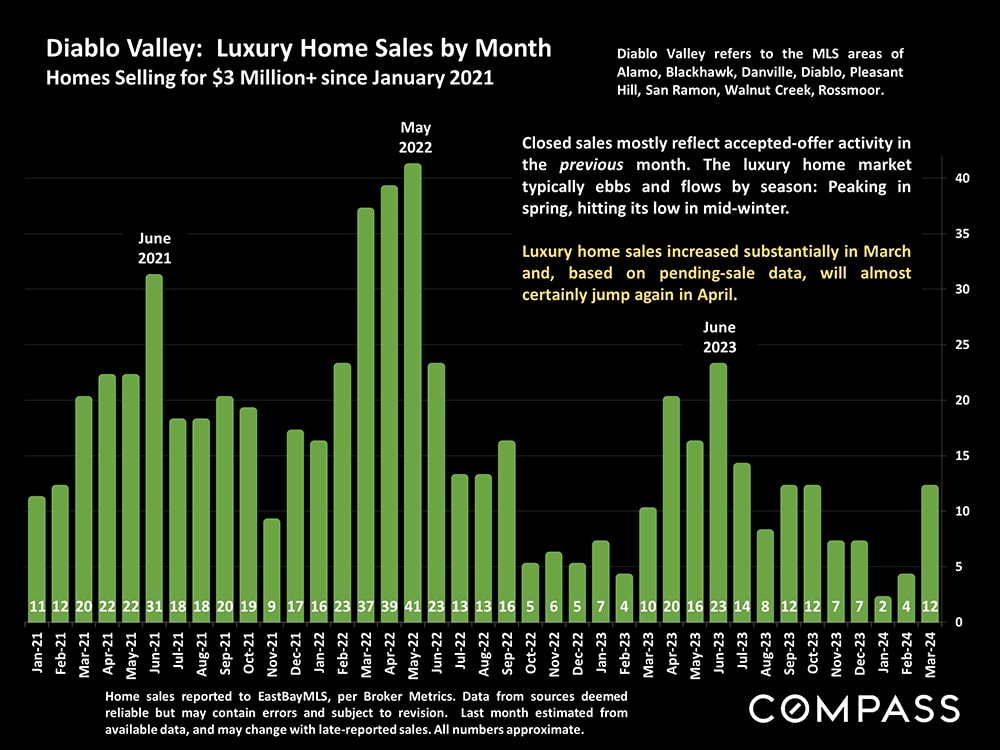
Chart of monthly Diablo Valley sales of homes priced at $3 million or more, January 2021–March 2024.
 
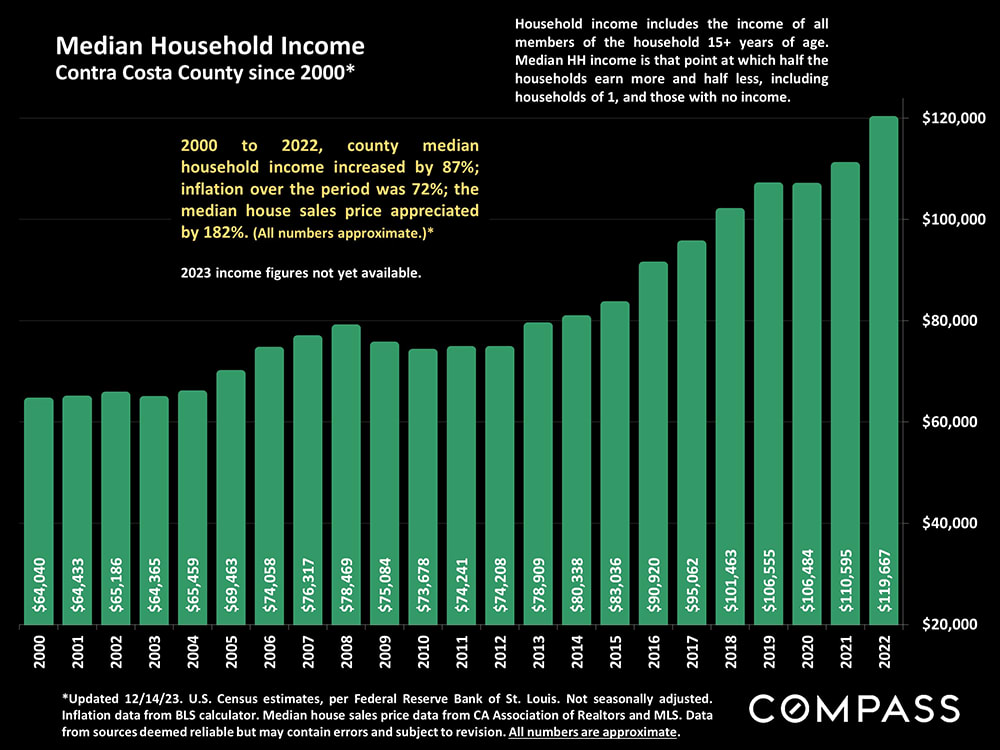
Bar chart of Contra Costa County median household income, rising from $64,040 in 2000 to $119,667 in 2022.
 
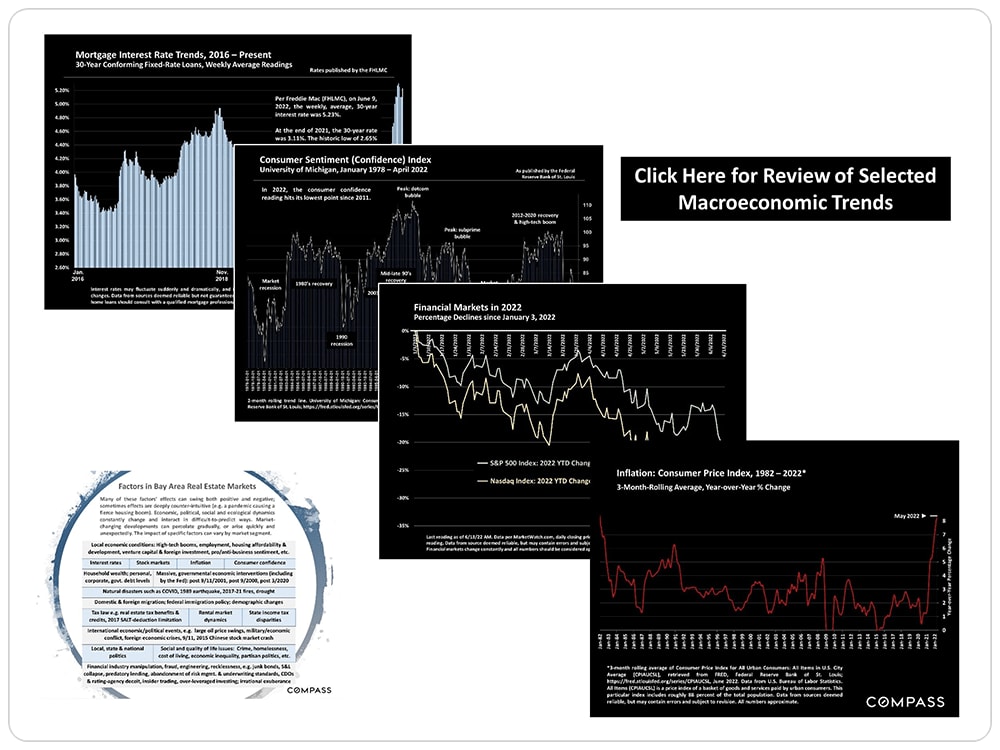
Collage of economic charts on mortgage rates, consumer sentiment, financial markets, inflation, and Bay Area real estate factors.

Work With Us

As the real estate experts in the Danville and Blackhawk areas, our team is committed to exceeding our client’s expectations, focusing on their best interests, and creating long-term relationships. We tirelessly do what it takes to list properties and get the desired results on both sides of the deal.

Follow Me on Instagram