
As the world turns another page in its calendar, we embrace the arrival of March with open arms and hearts full of anticipation. With each new month comes renewed hope, fresh opportunities, and the promise of exciting adventures ahead.
March, the gateway to spring, brings with it the promise of blooming flowers, warmer days, and the gentle whispers of change in the air. It’s a time to shed the layers of winter and embrace the vibrant energy that comes with the awakening of nature.
Wishing you a great day ahead, may you achieve whatever you have planned for today and the rest of the year.
Please do not hesitate to reach out if you have any questions about navigating the Spring market.


Our Featured Properties:

81 Eagle Ridge Place, Blackhawk | Behring Estate | Offered at $24,998,000

4456 Deer Ridge Road, Blackhawk | Offered at $5,999,800

10 Margaret Lane, Danville | Offered $4,500,000

SOLD - Represented Seller | 73 Turrini Circle, Danville | Sold for $4,495,000


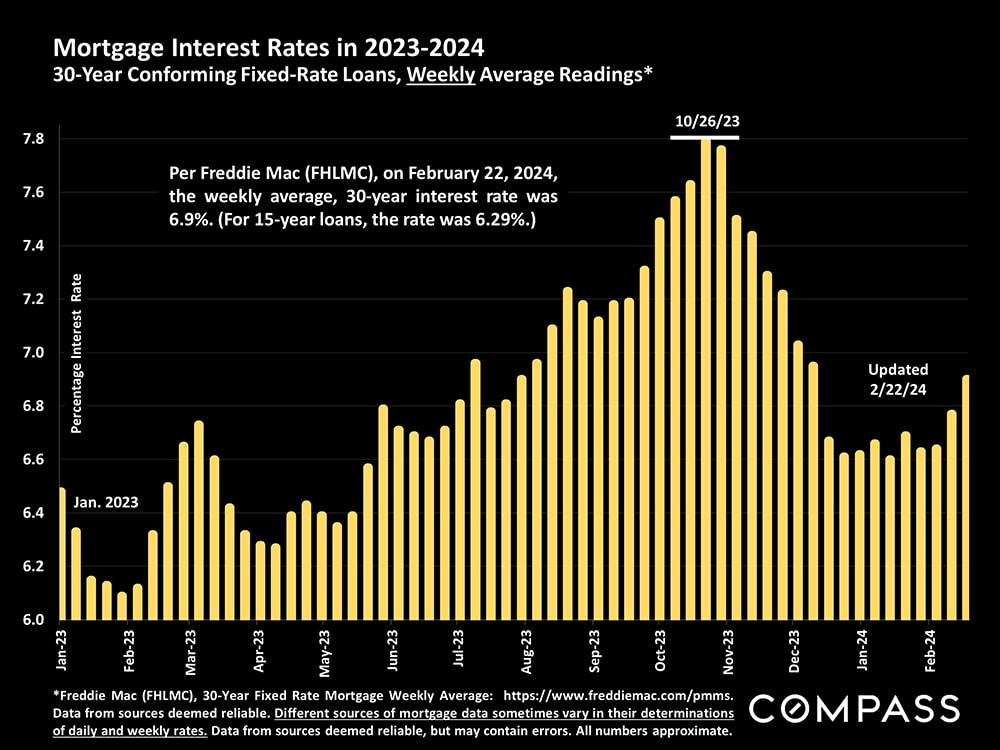
Interest rates are well below those seen late last year, but have started ticking up in mid-February.
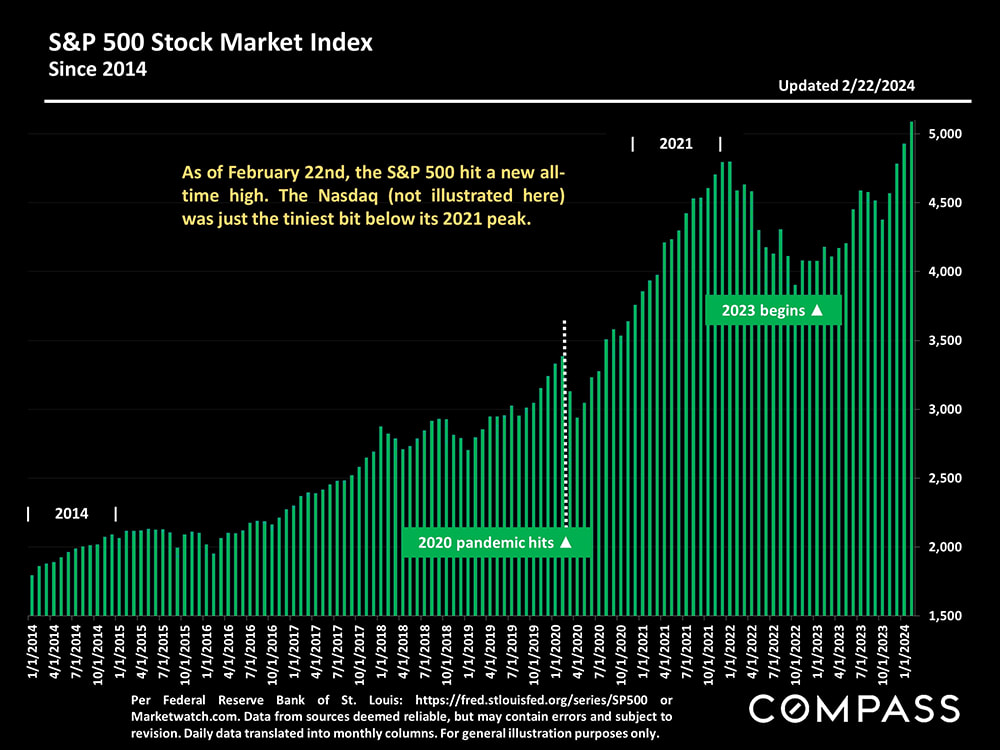
Through February 22nd, stock markets have continued to rebound dramatically, deeply impacting household wealth – especially among more affluent buyers.
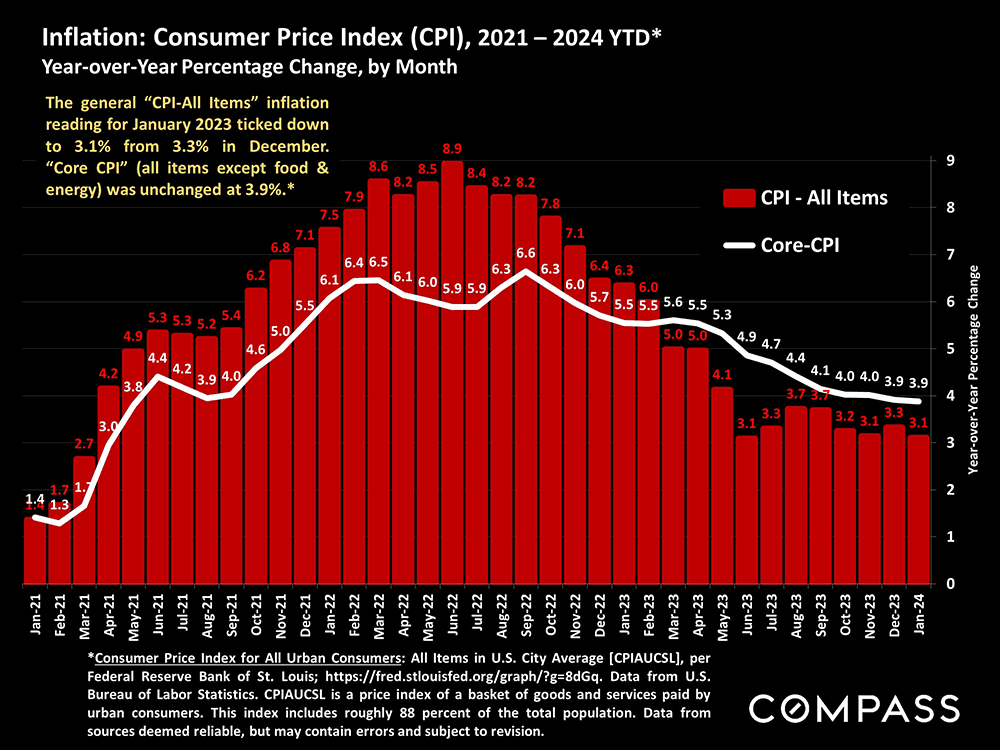
Having plunged from its peak in mid-2022, the inflation rate has not dropped as quickly as expected in recent months, a big factor in mortgage interest rates.
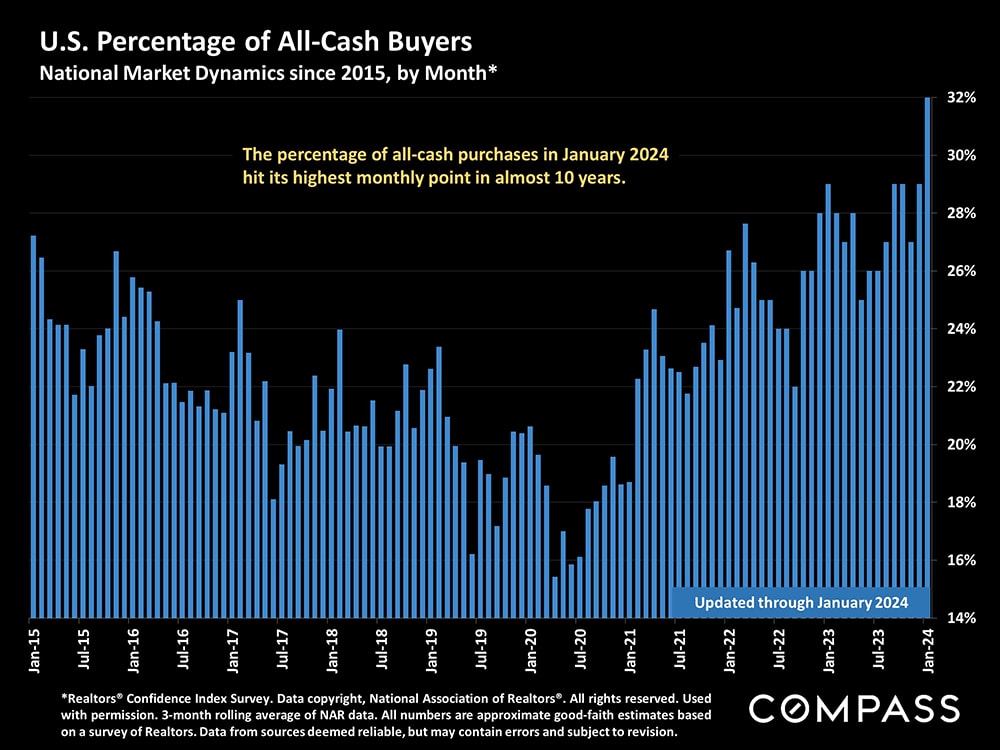
As a percentage of total sales, the share of transactions being completed by buyers paying all cash has continued to climb.
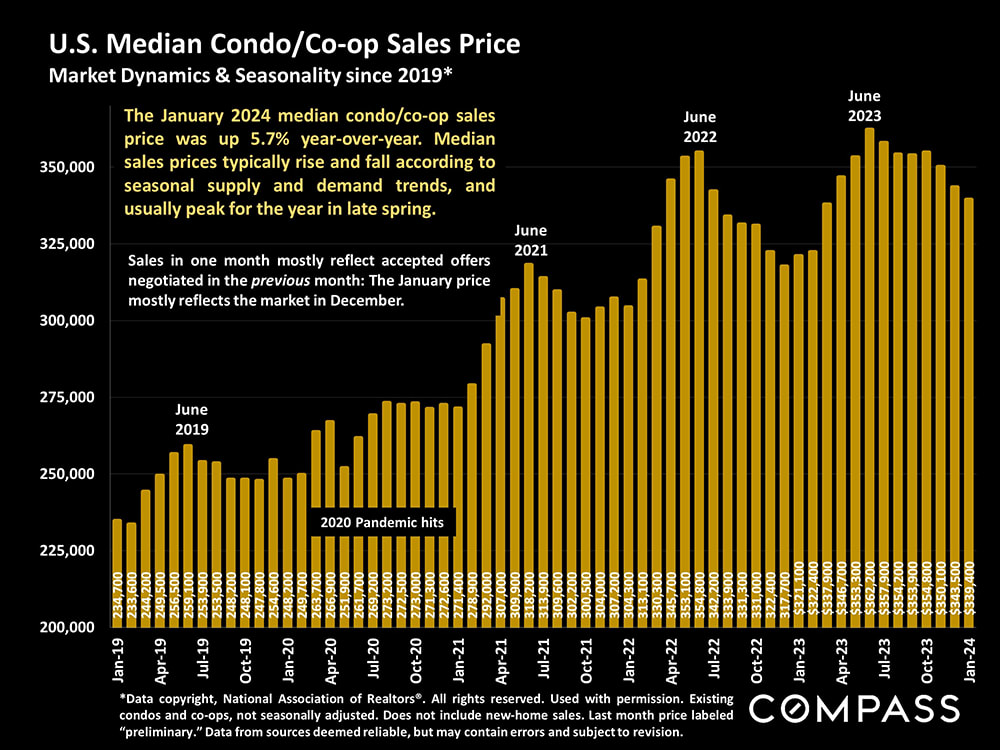
Median home sales prices rise and fall to seasonal supply and demand dynamics, and January prices mostly reflect the slow December market. Still, U.S. house and condo/co-op prices were up 5% & 5.7% respectively year-over-year.

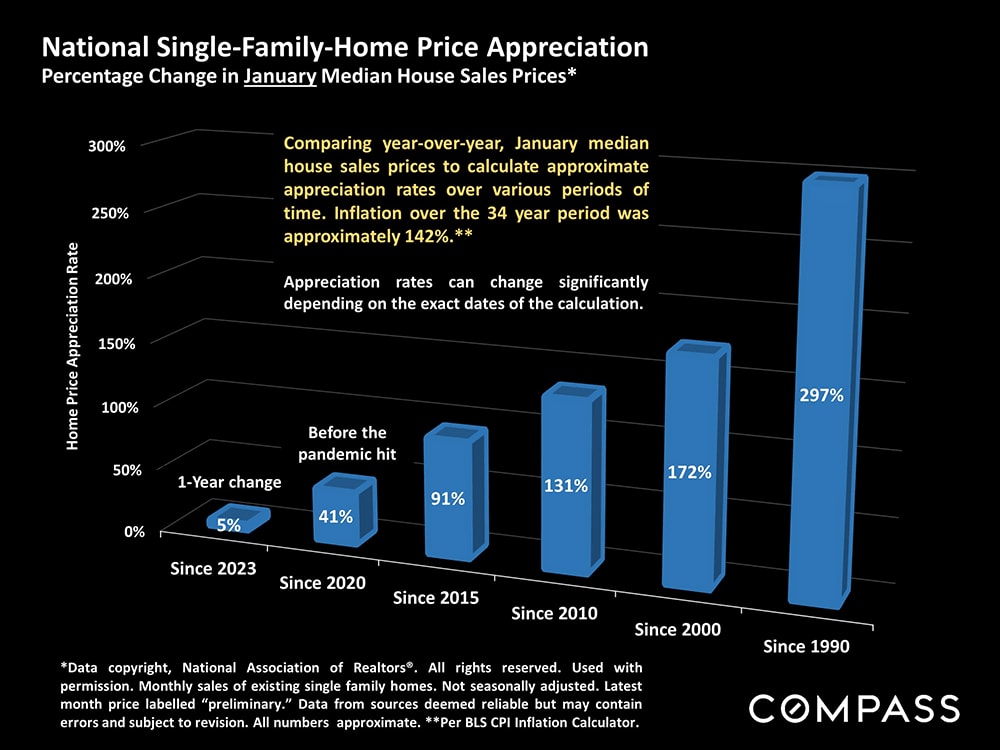
National house-price appreciation rates over various periods since 1990.
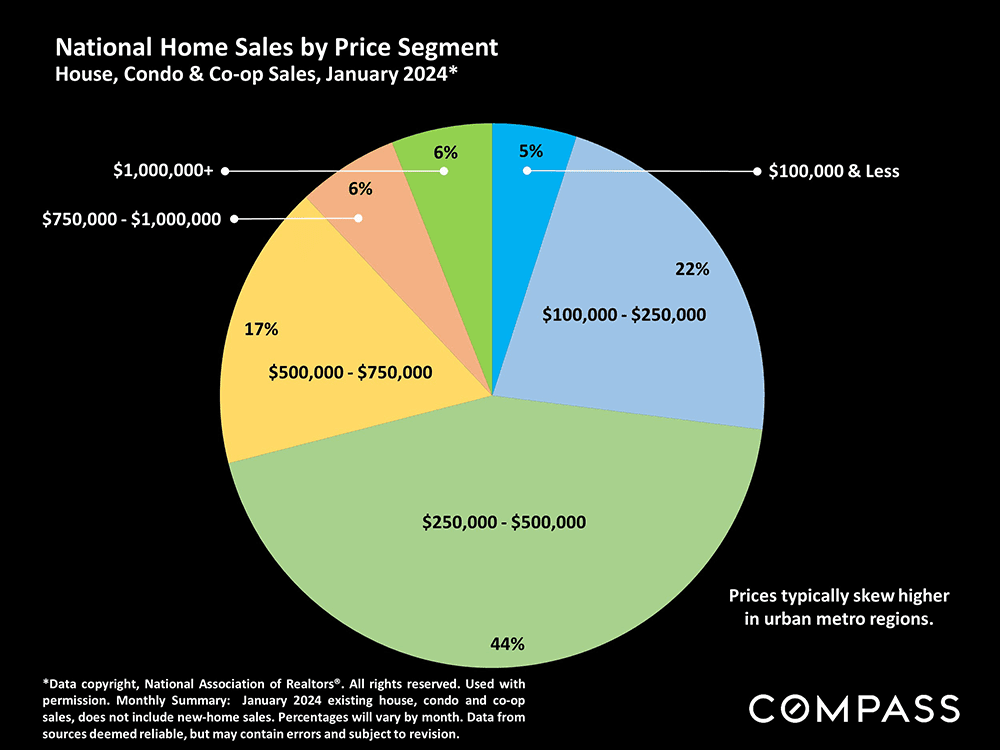
Home sales by price segment: Higher-price segments have recently seen by far the largest year-over-year increases in sales.
Median house prices in selected U.S. metro areas. “Metro areas” typically consist of large, multi-county regions.

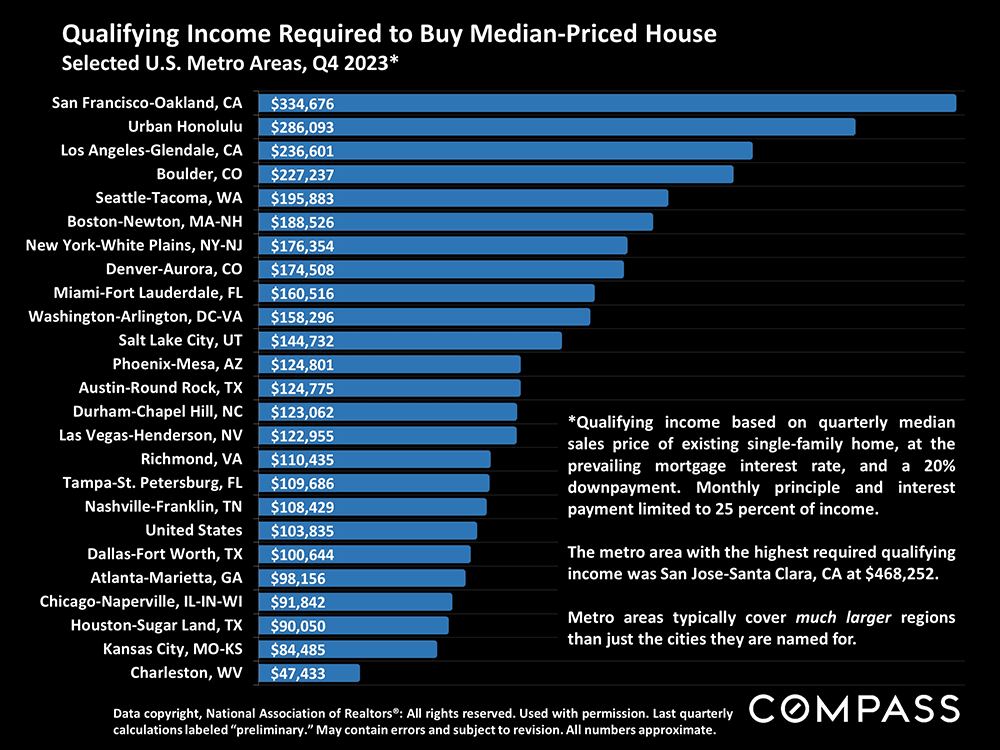
And a look at the approximate income required to buy a median-priced house in various U.S. metro areas, based on a 20% downpayment.
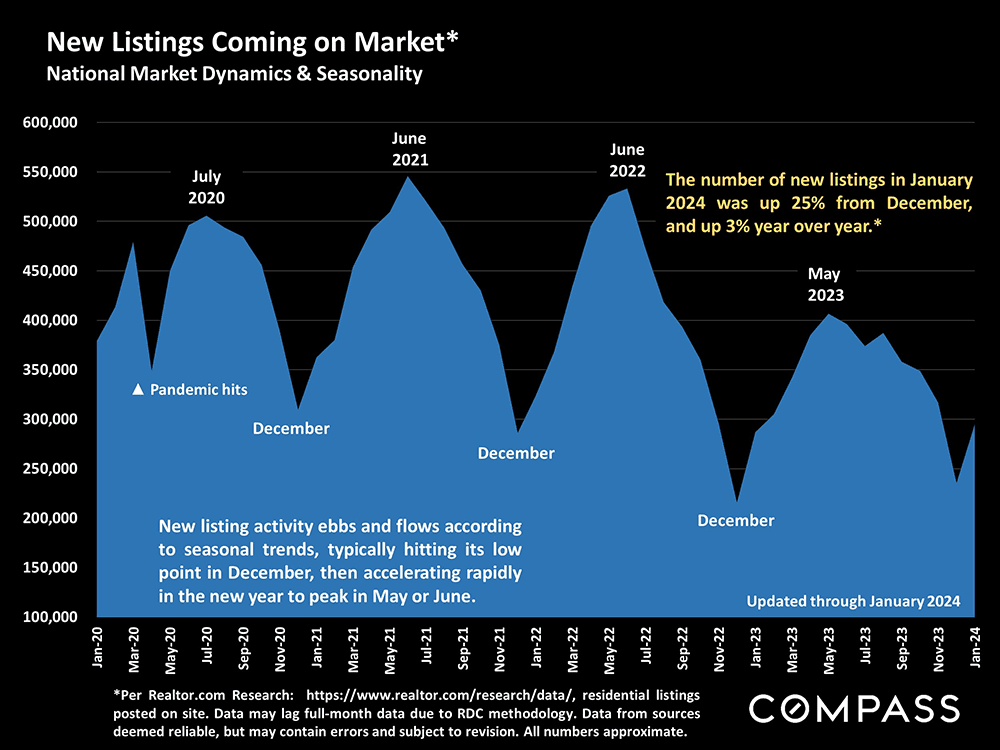
As the new year’s market wakes up, the number of new listings is spiking, but, so far in 2024, not enough to meet the acceleration in buyer demand. Since mid-2022, listing activity has plummeted due to the mortgage lock-in effect, but many analysts predict higher listing volumes this year.
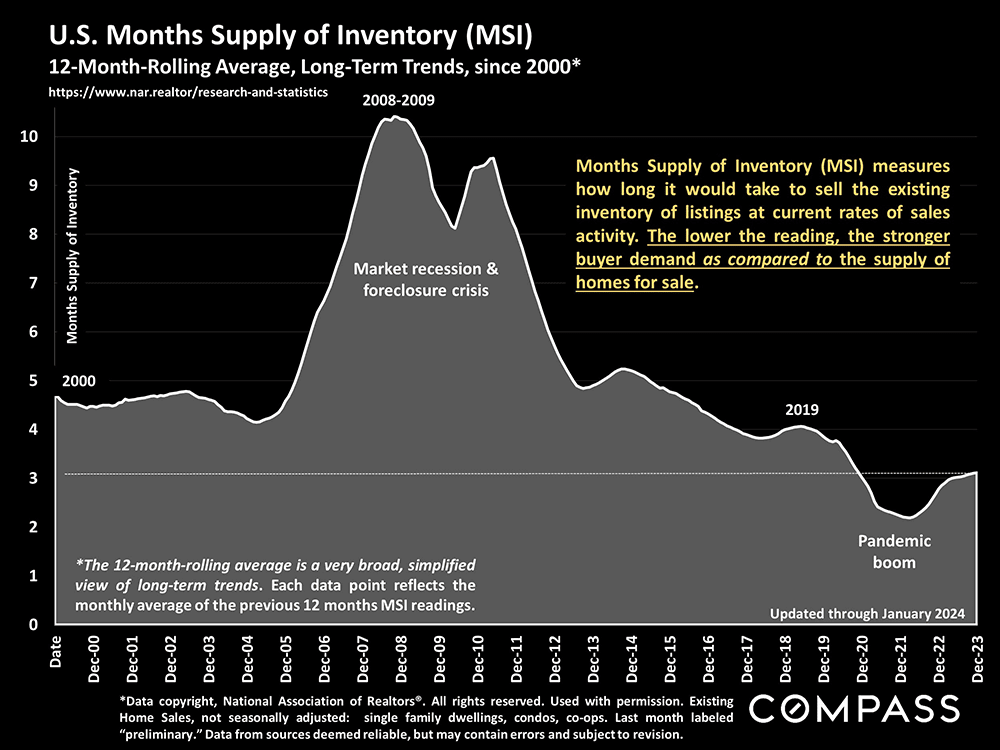
Months-Supply-of-Inventory measures supply as compared to demand: The lower the MSI, the more heated and competitive the market. During the pandemic boom, soaring demand dropped MSI to historic lows; since mid-2022, the plunge in listings has been the main factor in keeping MSI so low by historical standards.
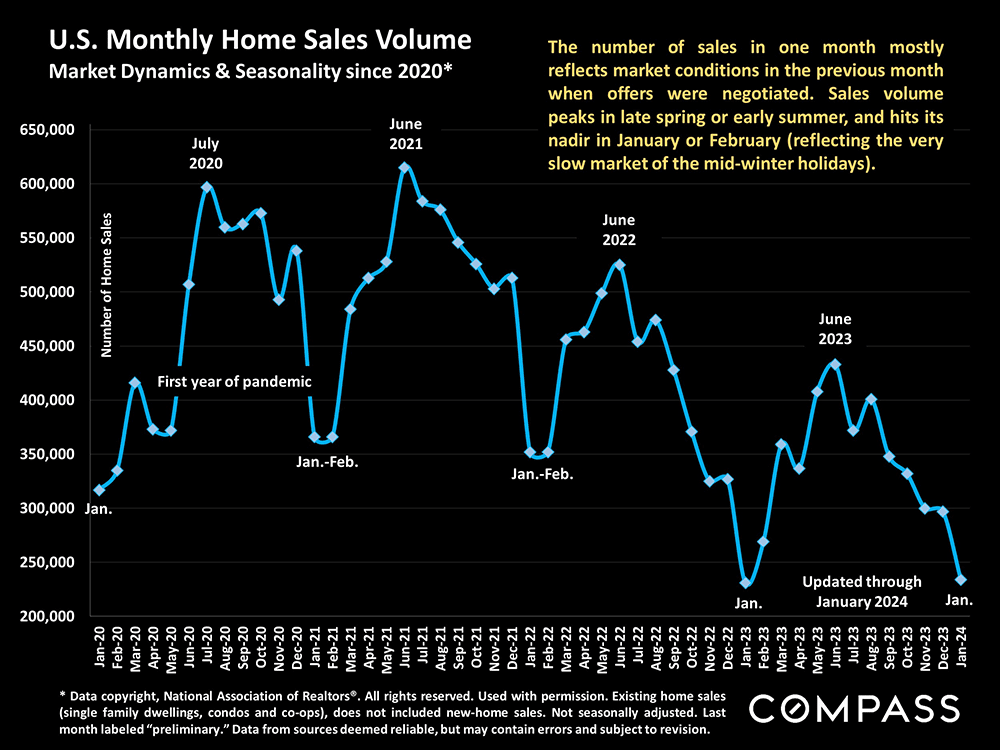
January sales volume reflects the very slow market of December, but moving into spring, the monthly number of sales should begin rising quickly. Click on the image below for our overview report on market seasonality.
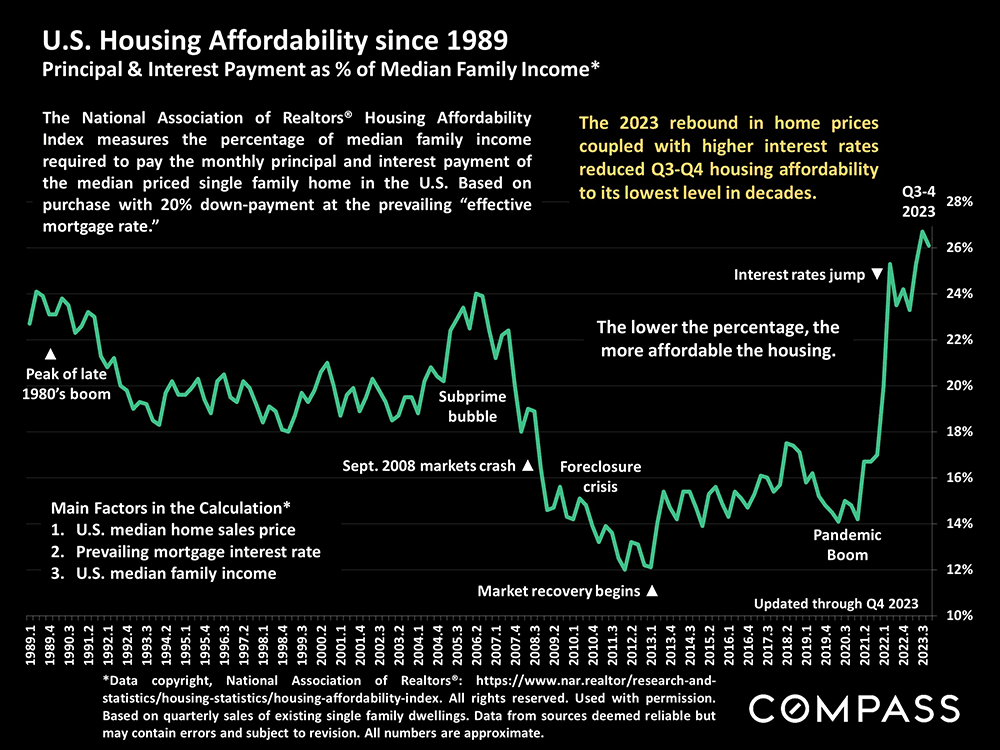
Strong demand vs. an inadequate supply of homes for sale, plus higher interest rates, have severely impacted housing affordability.
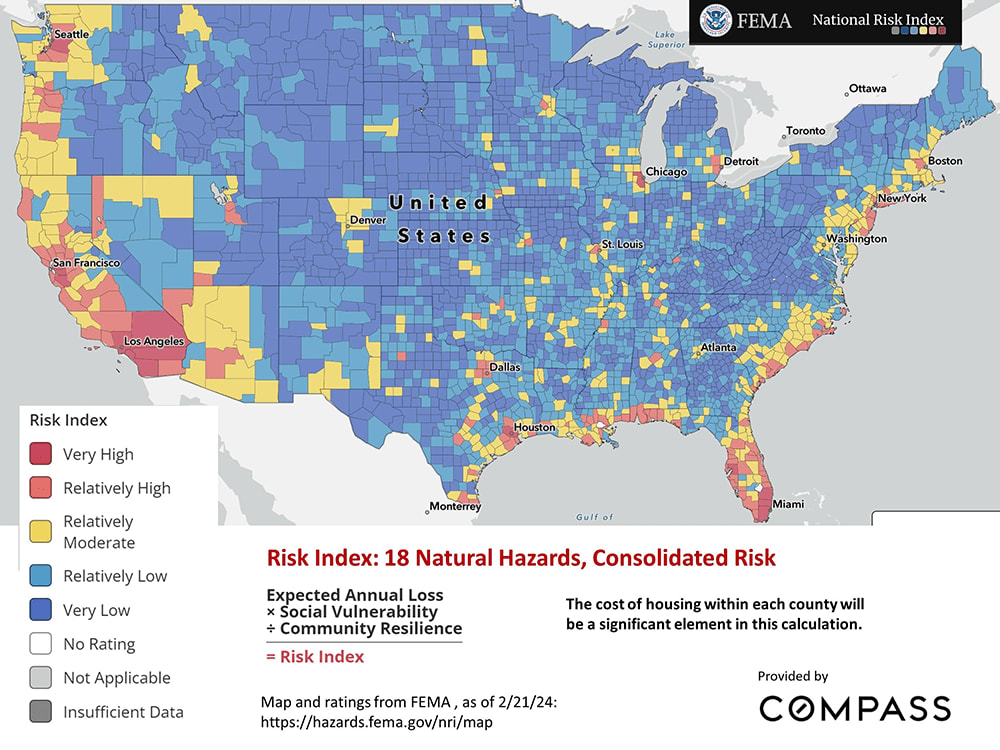
FEMA evaluates social and economic risk against 18 different natural hazards, including floods, wildfires, earthquakes & hurricanes. Click on the image below to review a series of FEMA’s Risk Index maps.
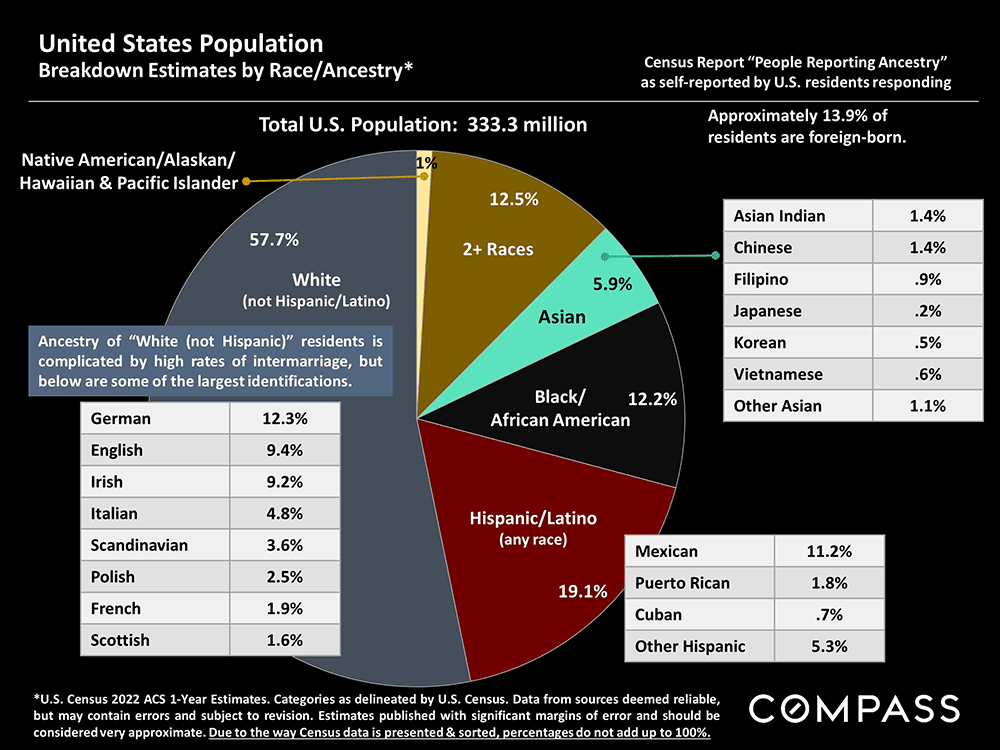
A limited illustration of Census data regarding U.S. population diversity. People have come and continue to arrive from every country across the globe – which is another significant factor in many regional housing markets.


-
Is there a Shell, Mobil, etc gas station close to you? Now the next ‘gas/power’ station is, TESLA, as it opens its charging stations to Ford and other EVs. (CNBC)
-
In 2018, corporate tax rates were cut (long overdue as the US’s 35% corporate tax rate was noncompetitive globally), now, 5 years later, the reality: of 342 corporations studied, the average effective tax rate paid was 14%, significantly lower than the 21% rate publicized. 87 corporations paid an average of less than 10%. T-Mobile, which was profitable each year, paid zero taxes. Netflix and Nike were amongst the lowest taxed too. Bank of America made $138 billion in profits between 2018 and 2022 and paid $5.3 billion in federal taxes, an effective rate of 3.8%. (Institute of Taxation and Economic Policy)
-
Is a Whole Foods Market Daily Shop coming to your hood? These new, smaller Whole Foods will range between 7,000 -14,000sf – a fraction of Whole Foods stores, which average about 40,000sf. The first one comes to the Upper East Side in NYC where 5 leases have already been signed.
-
What is the happiest city in the US? According to WalletHub here are the TOP 10, based on Emotional and physical well-being, Income and employment, and Community and environment:
- Fremont, Calif. (Fremont has the country’s lowest separation and divorce rate, at only 8.9% and the highest earning middle class)
- Overland Park, Kan. (lowest poverty rate in the US)
- San Jose, Calif.
- Madison, Wis.
- Irvine, Calif.
- Honolulu, Hawaii
- San Francisco, Calif.
- Pearl City, Hawaii
- Columbia, Md.
- Scottsdale, Ariz. (CNBC)
- Fremont, Calif. (Fremont has the country’s lowest separation and divorce rate, at only 8.9% and the highest earning middle class)
-
The wildfires in Texas and Oklahoma have already scorched about 2,000 square miles, roughly the same amount of land as the entire state of Delaware. It’s the largest fire in Texas history since records were kept in the 1980s. Over 500 structures have been destroyed and 110 miles of electrical lines will need to be replaced. 85% of cattle in Texas are raised in the panhandle. Meanwhile in the Northwest, up to 12 FEET of snow and 100 mph-plus winds. (CNN)
Please let me know if I can ever be of assistance, in any way, to you or your family, friends, and colleagues.