
On Monday, we take a moment to celebrate the hard work and dedication that keep our world turning. Whether you’re taking a well-deserved break or simply enjoying some extra time with loved ones, remember that this day is all about honoring the contributions of workers from all walks of life. So, kick back, relax, and let’s toast to the power of teamwork and the value of a job well done. Cheers to you!

#1 Agent in Danville 2022 – 2023
#1 Agent in Blackhawk 2013 – 2023
Top 100 Nationwide WSJ/RealTrends 2022 – 2024


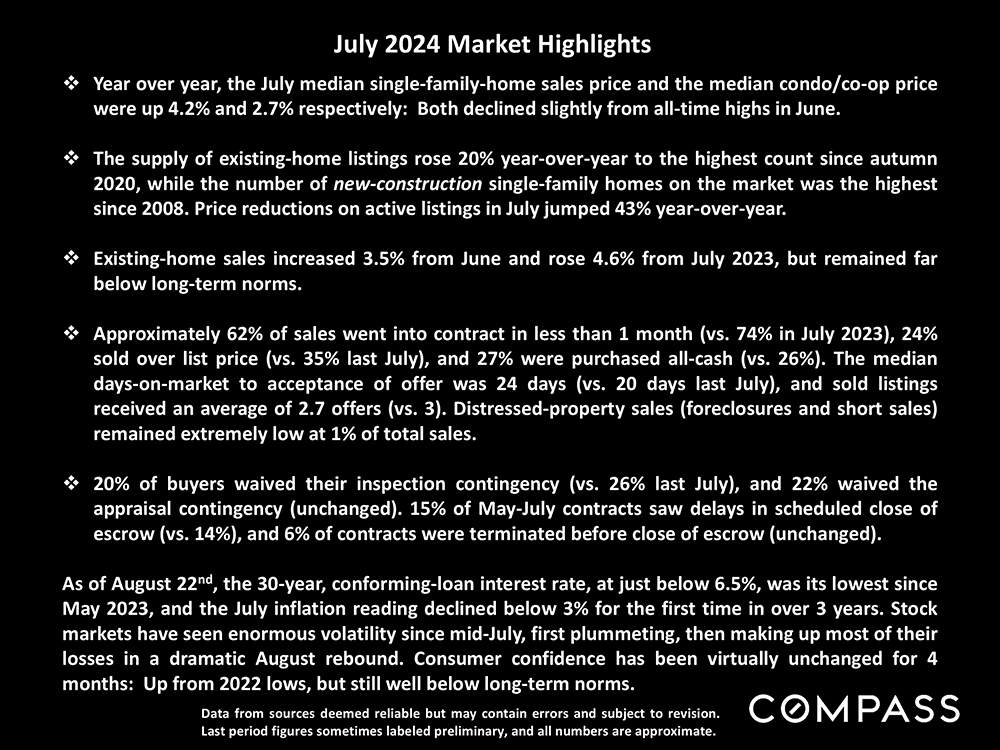
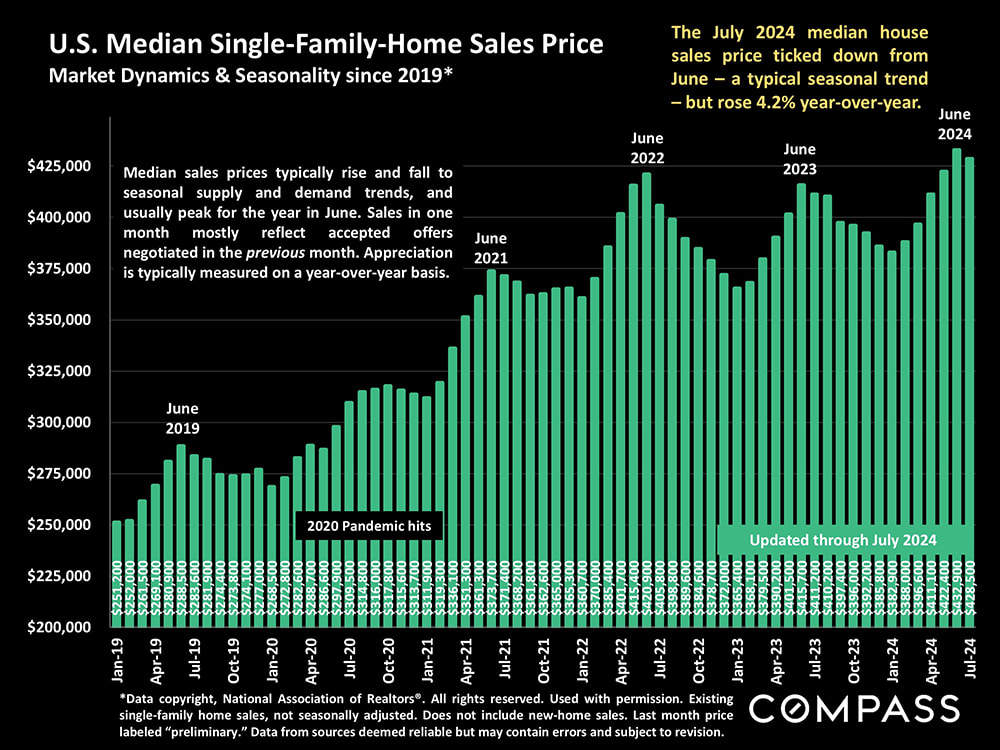
The U.S. median house sales price in July, $428,500, declined slightly from the previous month’s peak: Median sales prices often peak for the year in June.
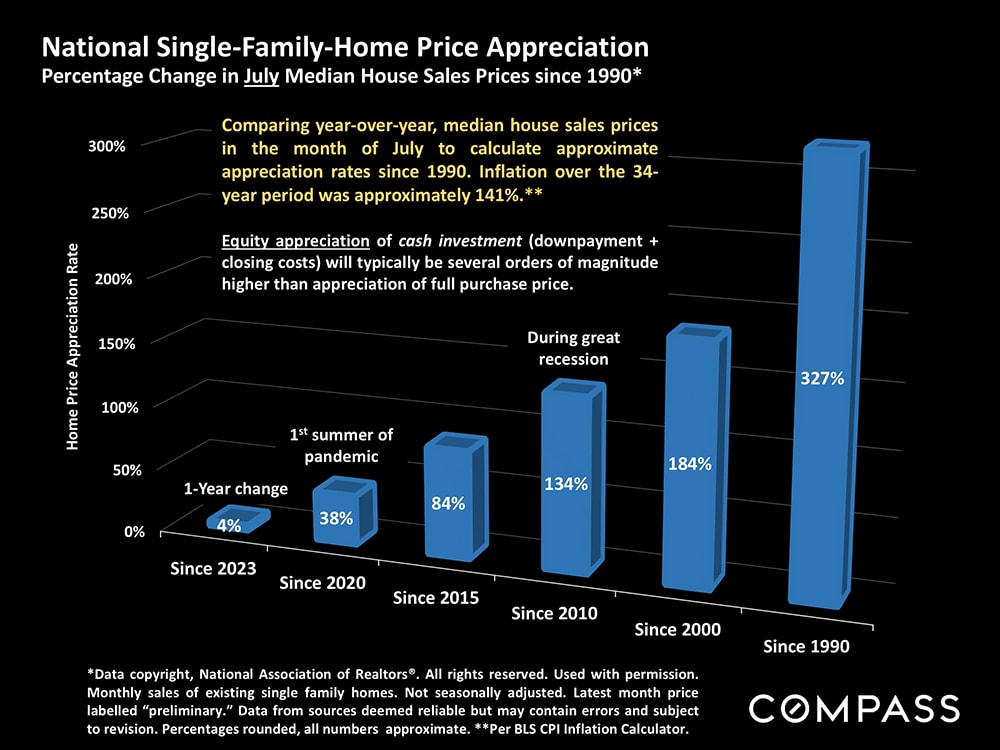
Median house sales price appreciation since 1990: An illustration of how home ownership so often builds household wealth over time.
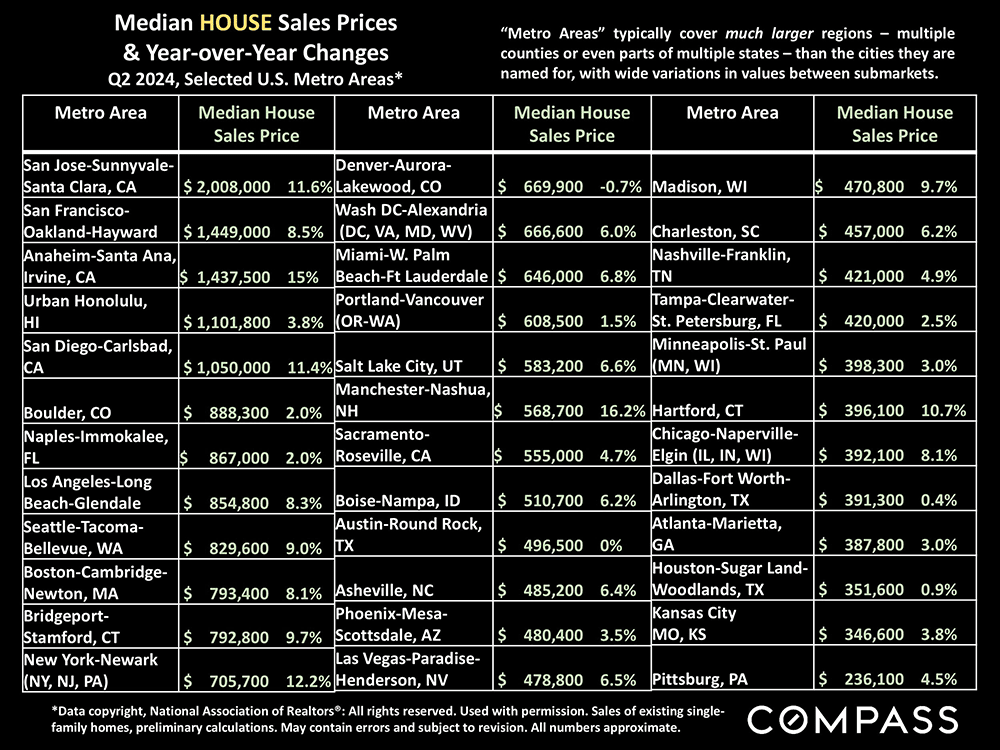
Q2 median house sales prices and year-over-year appreciation rates for selected metro areas: 89% of U.S. metros saw y-o-y price gains. Boosted by its “AI boom,” the San Jose metro became the first to see a quarterly median price of over $2 million.
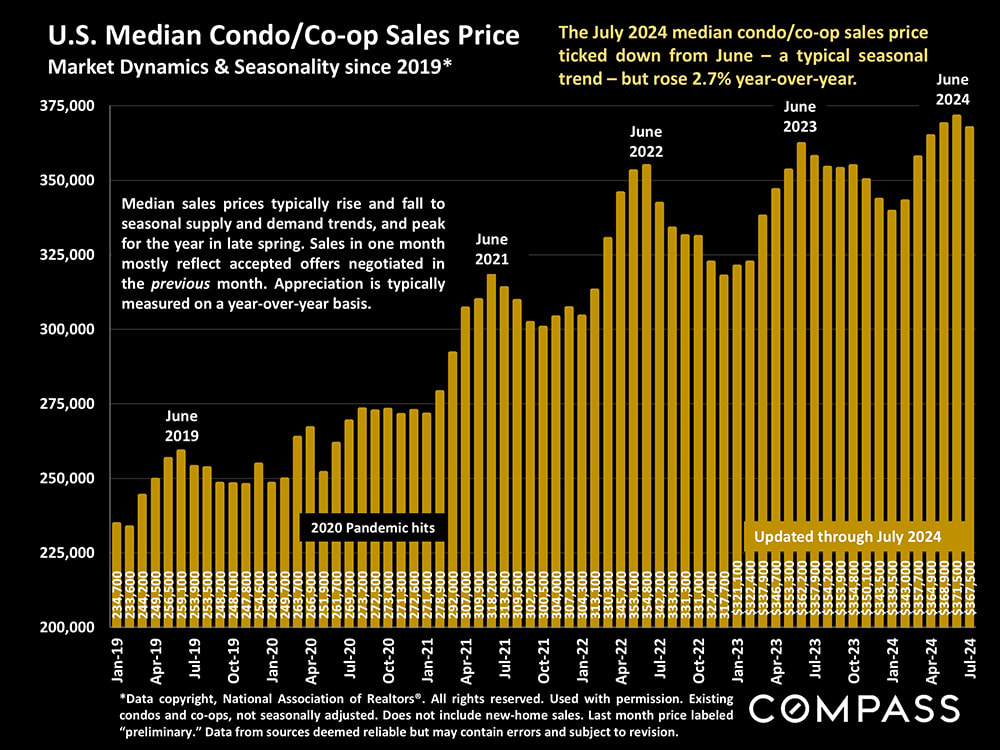
The median condo/co-op sales price in July, $367,500, also dropped slightly from its peak in June. Condos and co-ops are most common in urban markets.
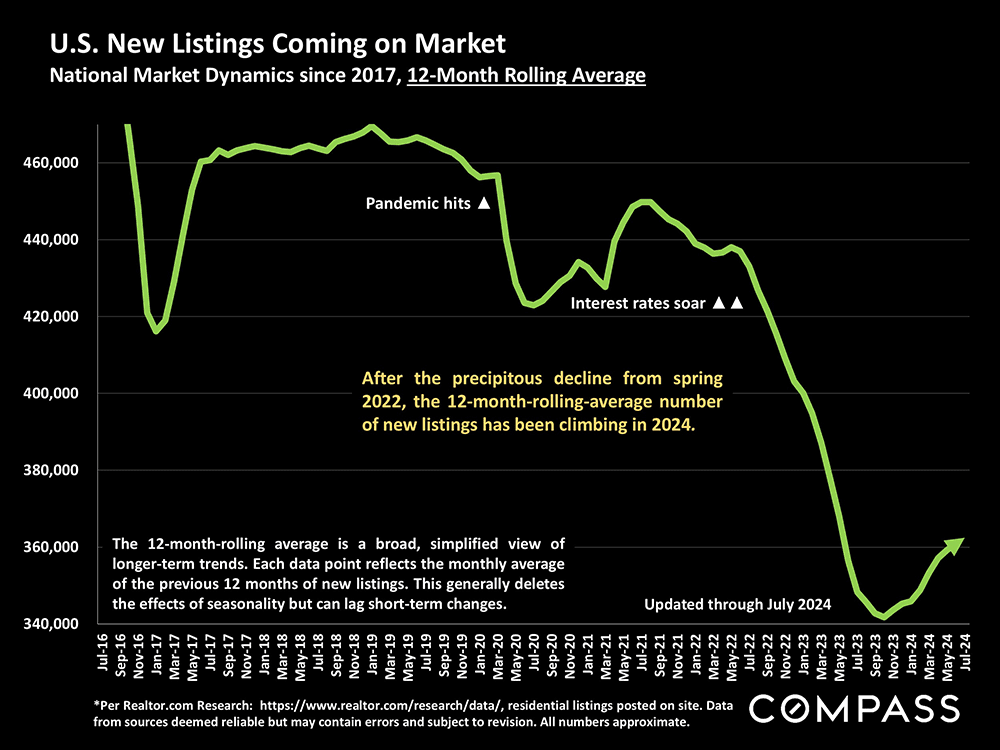
This longer-term chart using 12-month-rolling data illustrates the dramatic changes in new listing activity in recent years: The huge plunge after interest rates soared – mostly due to the “mortgage lock-in effect” – and the beginning of a recovery.
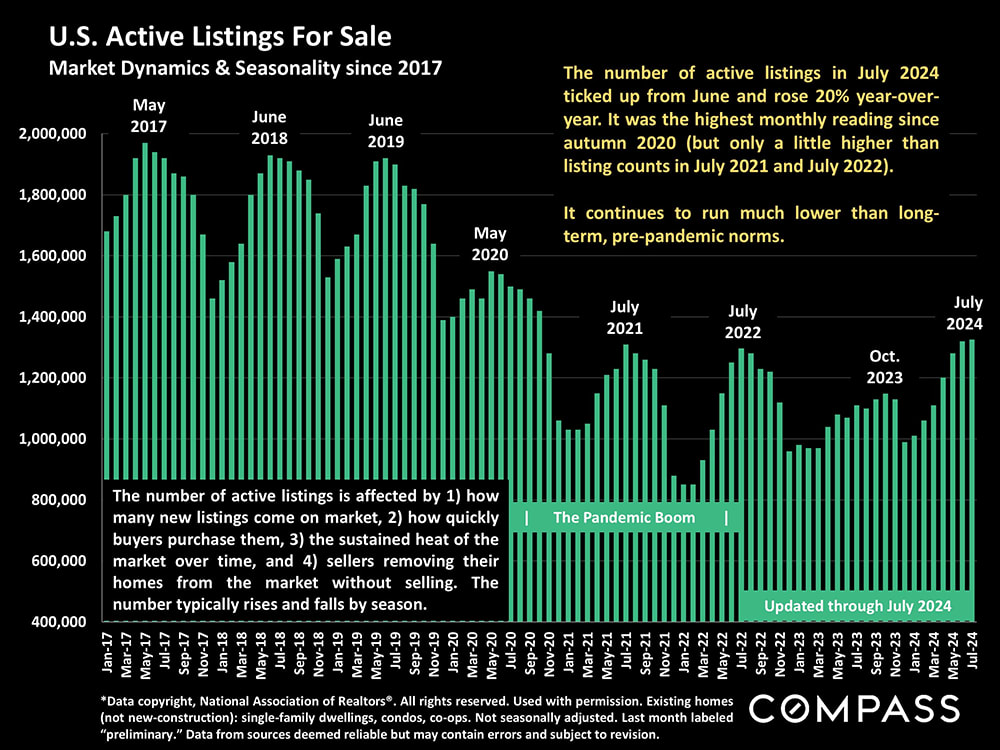
The number of resale homes on the market has been climbing, a critical shift in supply and demand dynamics, and good news for buyers if it continues.
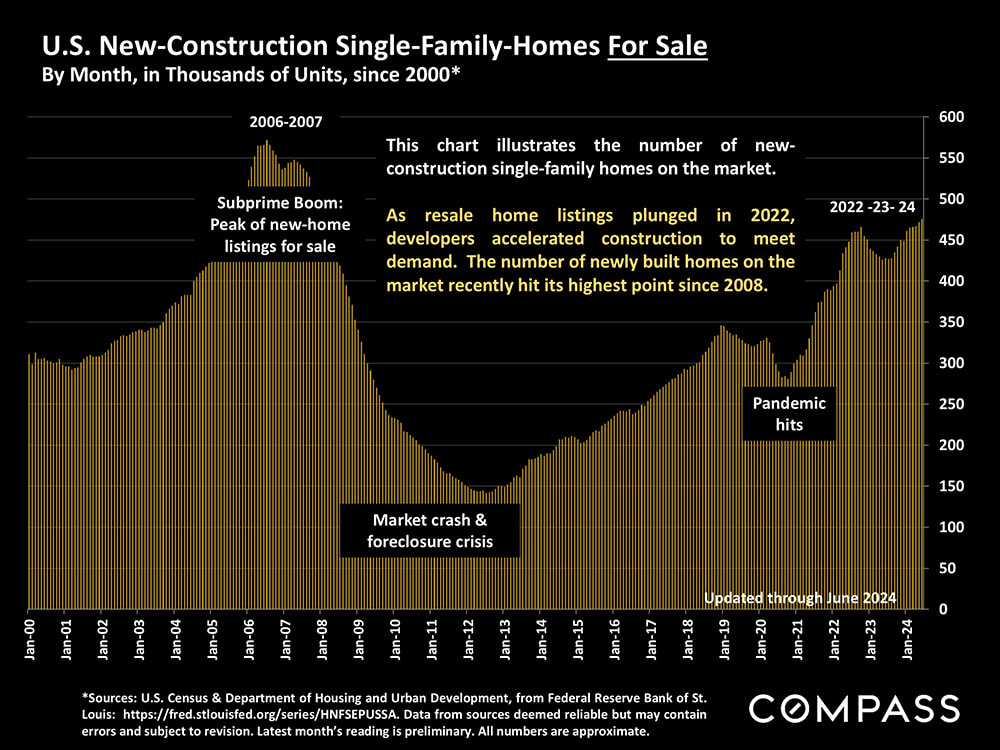
The number of new-construction single-family homes for sale is at its highest in 16 years, but these are highly concentrated in a limited number of markets.
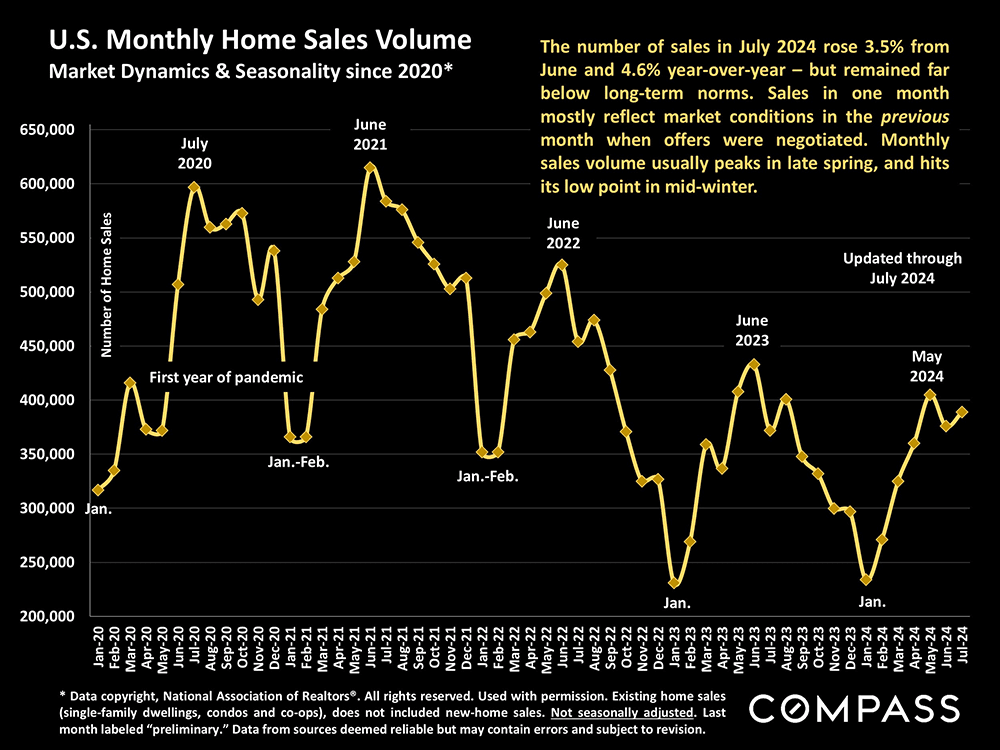
Due to factors such as limited inventory and interest rates, the number of existing home sales continues to run low by long-term standards. This chart also illustrates the terrific impact of seasonality on market activity.
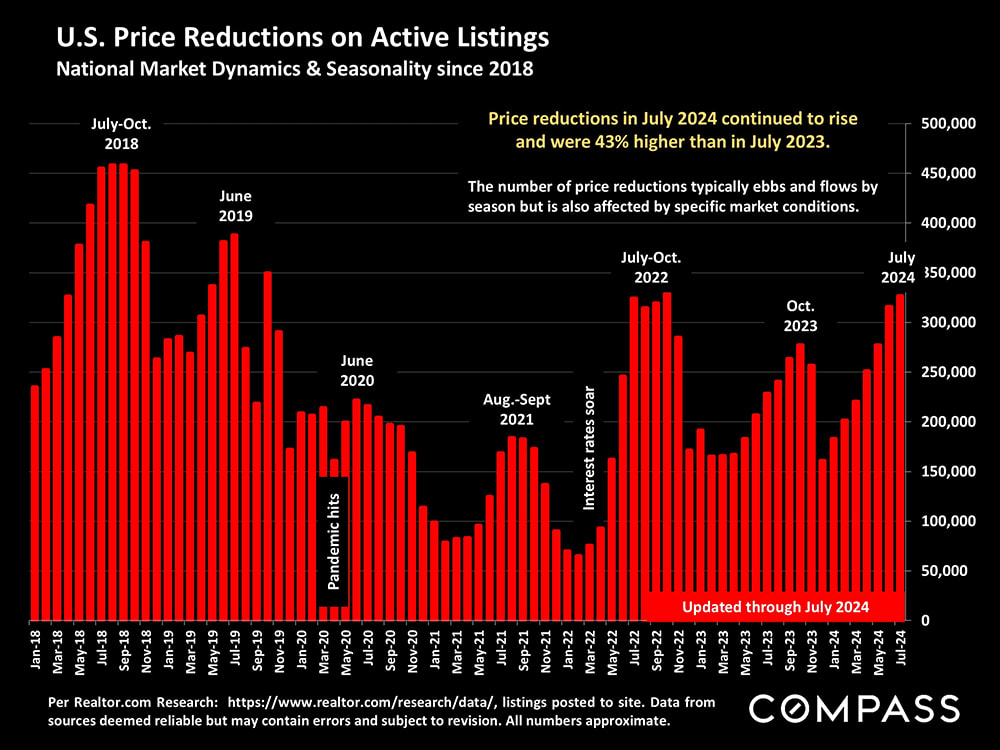
Price reductions are still increasing as more sellers adjust asking prices to attract buyers.
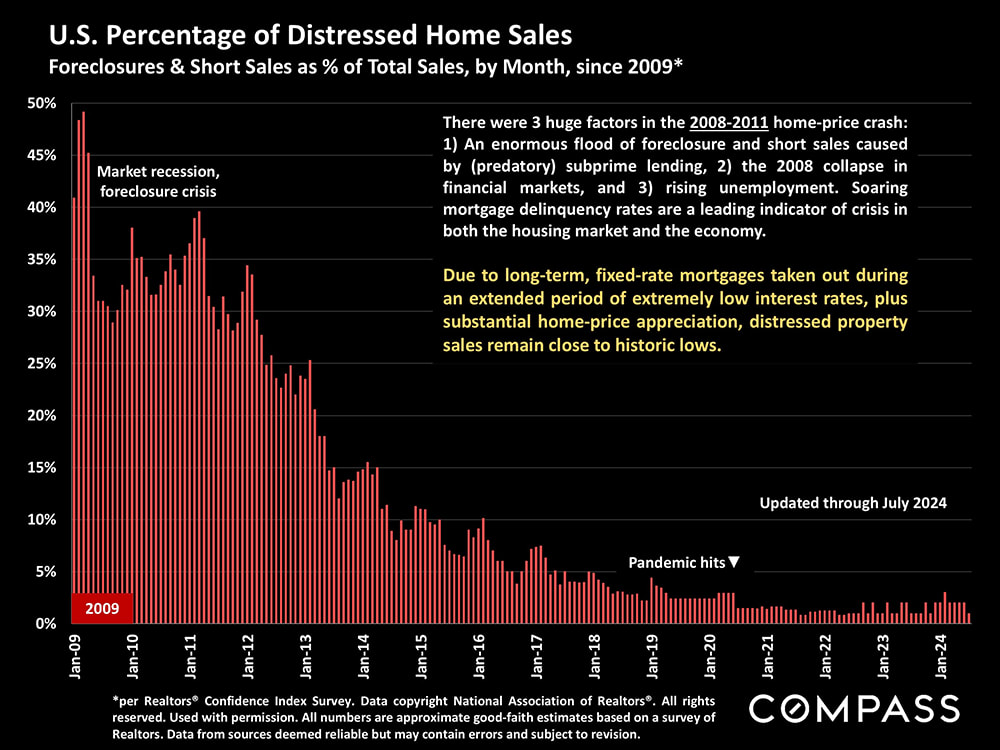
With a large majority of homeowners having low-interest-rate mortgages and high home-price appreciation rates since purchase, distressed property sales – such a big issue in the great recession – are a negligible issue now.
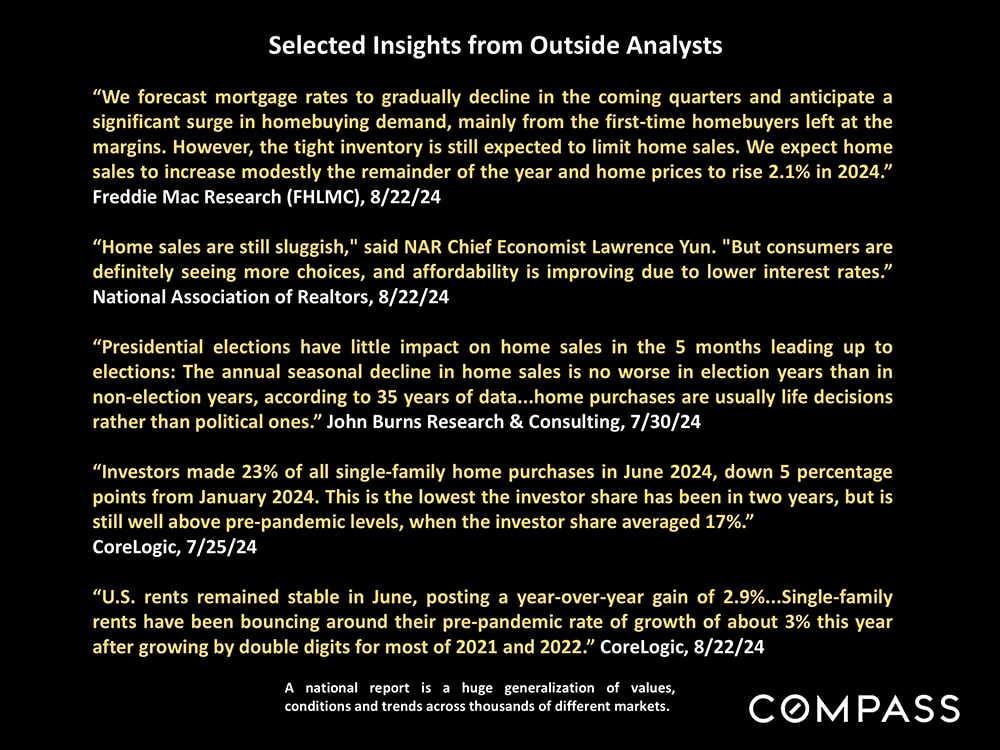
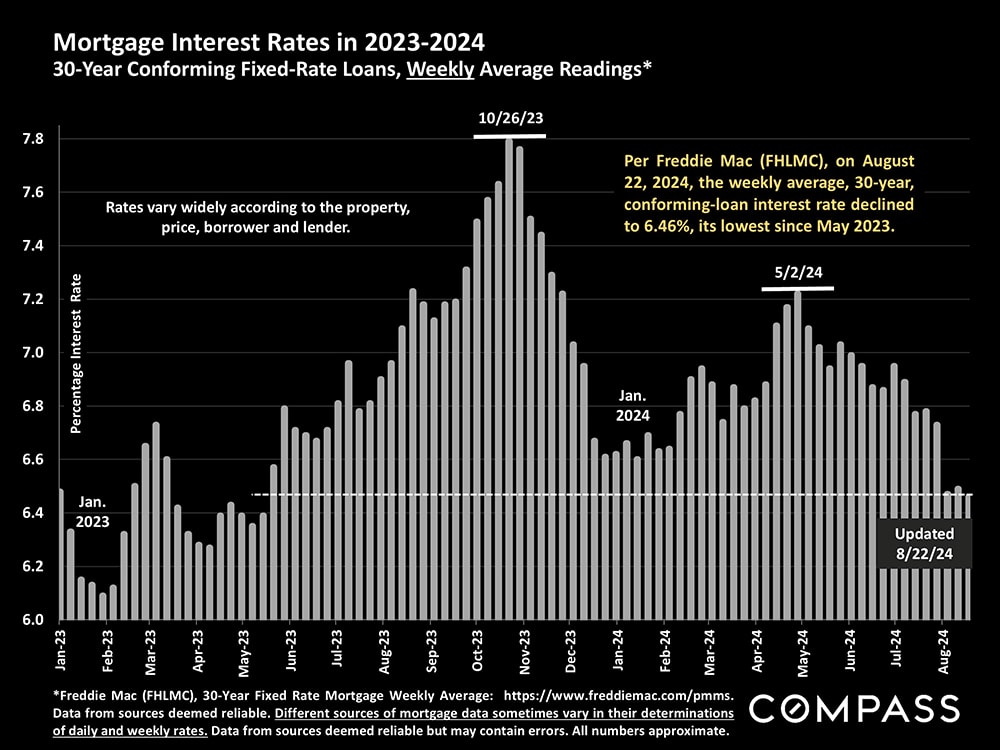
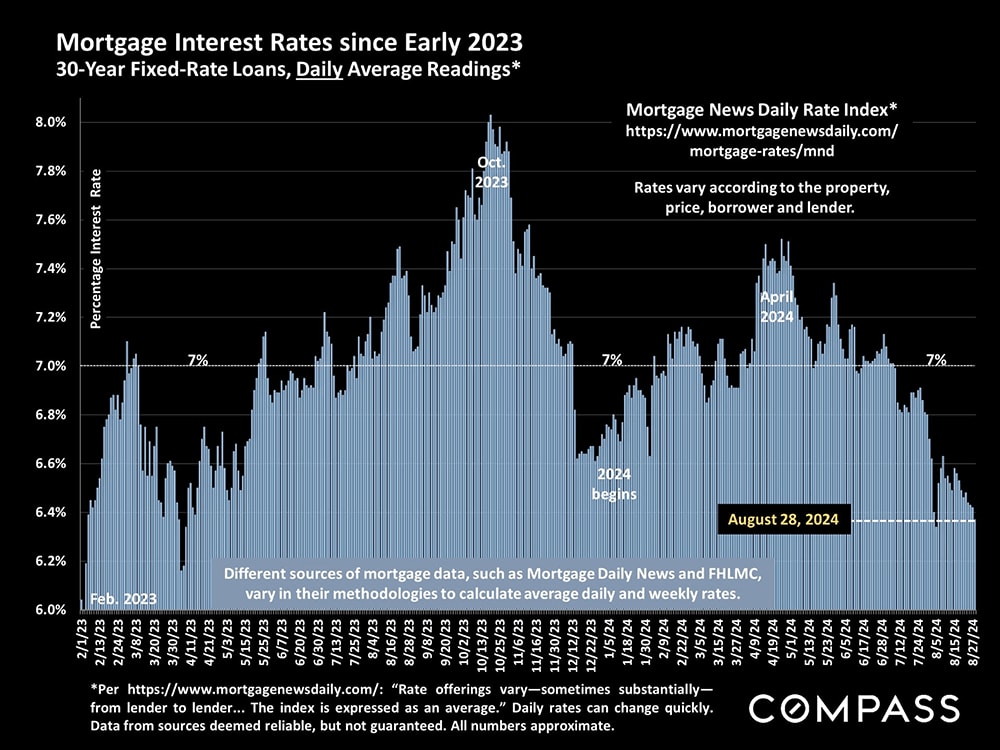
Mortgage interest rates are at their lowest in well over a year, with many economists predicting further declines in 2024.
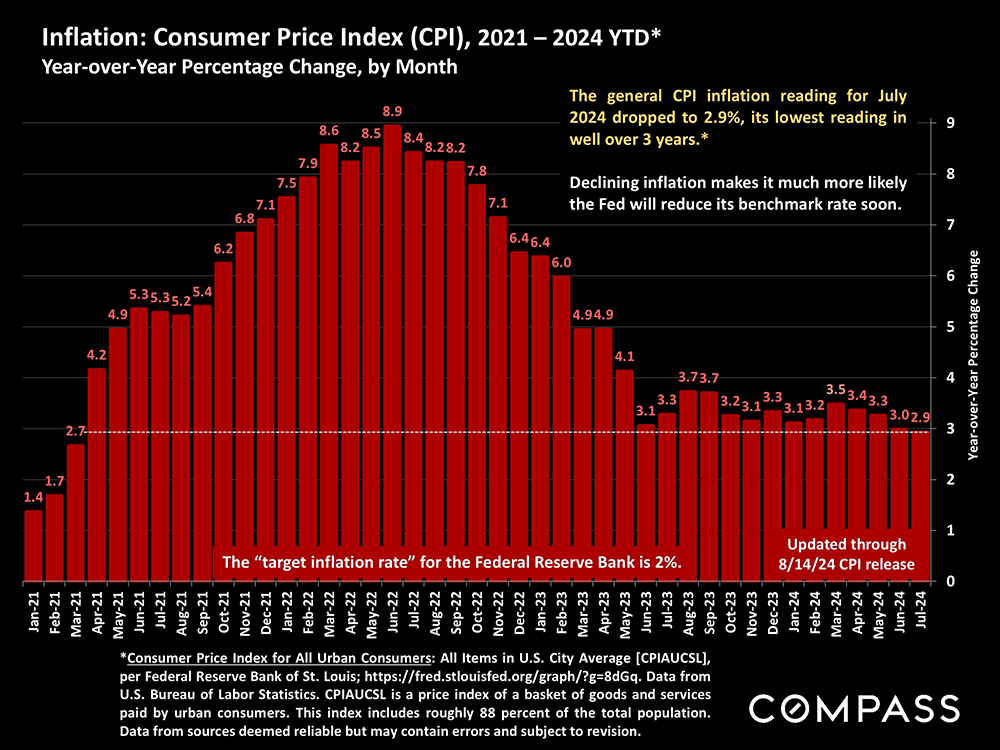
No economic indicator has been more obsessively watched – or had a greater impact on interest rates and household finances – than inflation. Its recent decline below 3% has led many to predict the Fed will finally drop its benchmark rate in September.
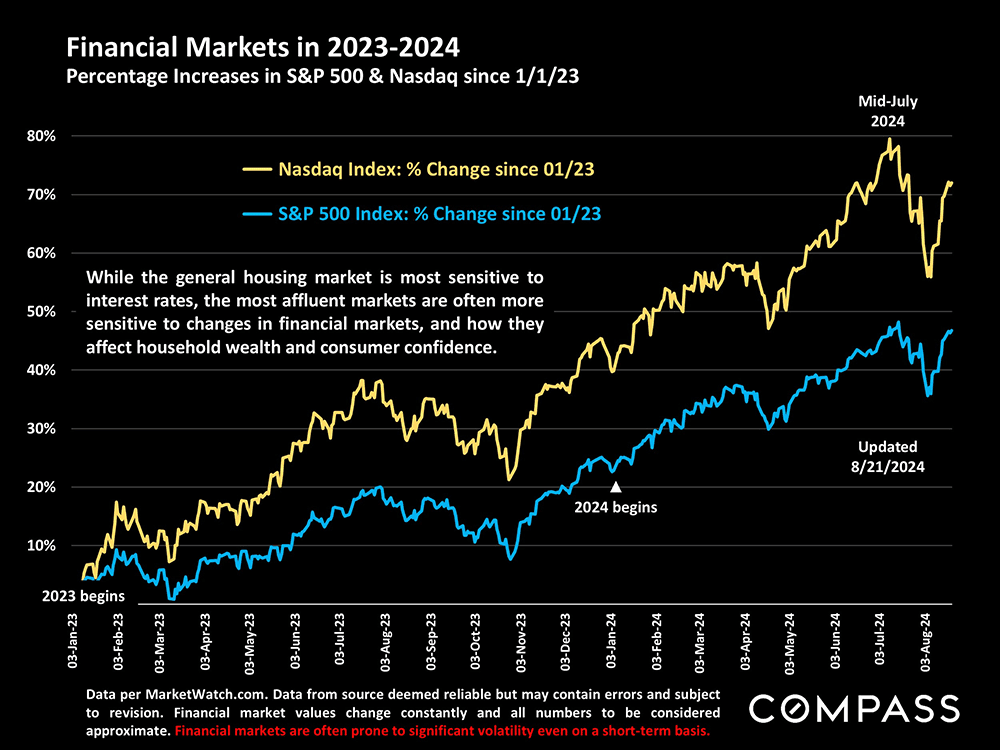
Stock markets have recently been on a roller coaster ride, but remain much higher than at the beginning of the year.
Please let me know if I can ever be of assistance to you, your family, friends, or colleagues
VIEW OUR ICONIC LISTINGS